
CASES BY LOCATION: 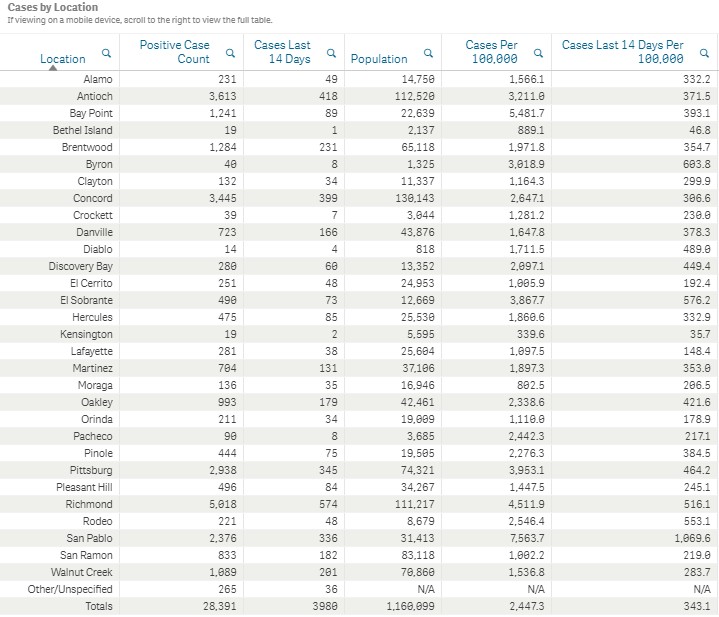
DEATHS BY LOCATION: 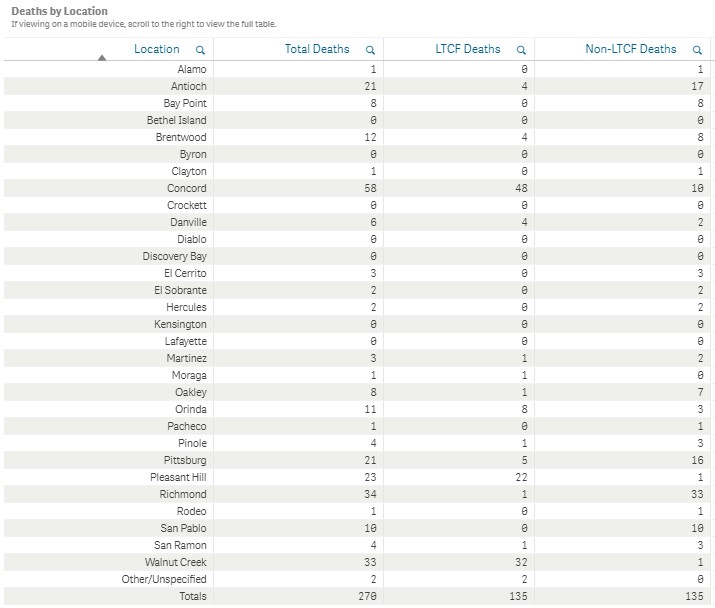
Contra Costa County COVID-19 data as of Wednesday Dec.9, 2020:
- Total cases (since March) – 28,391
- Total active confirmed cases – 4,174
- Recovered cases – 23,947
- Total tested – 670,250
- Deaths – 270 (three deaths from November added to the county’s COVID-19 dashboard since yesterday)
- Nobody under 30 years old has died – 135 deaths in nursing homes
- There are currently 20 active COVID-19 outbreaks in Contra Costa nursing homes
Contra Costa County COVID-19 Hospital Data:
- COVID-19 patients currently hospitalized – 143
- Occupied ICU beds – 138 (39 COVID patients)
- Available ICU beds – 34
- Available ventilators – 218
PREVIOUS DAY NUMBERS SHOWN BELOW:
Contra Costa County COVID-19 data as of Tuesday Dec.8, 2020:
- Total cases (since March) – 28,088
- Total active confirmed cases – 4,128
- Recovered cases – 23,693
- Total tested – 664,281
- Deaths – 267
- Nobody under 30 years old has died – 134 deaths in nursing homes
Contra Costa County COVID-19 Hospital Data:
- COVID-19 patients currently hospitalized – 140
- Occupied ICU beds – 120 (34 COVID patients)
- Available ICU beds – 45
- Available ventilators – 222
While we’ve seen very small numbers of ICU patients out of the 1.2 million inhabitants of Contra Costa County move up a small amount, we’ve seen nothing close to the exponential increase in cases and the Thanksgiving surge that the media couldn’t stop talking about in the lead up to Thanksgiving. In the meantime business are closing and unemployment is going up. Not so fun fact, for every 1% increase in the unemployment rate in the US, 37,000 people die. I also worry about the mental health of our children, let alone how far they are falling behind their private school peers. I think our leaders have meant well, but California leadership in general isn’t handling this well at all.
Economic relief is sorely needed, hopefully congress can get funds to our small businesses.
ONE study, conducted almost 40 years ago, came up with this number in the context of companies moving jobs overseas. I would not put much faith in what one study done that long ago dealing with long-term job loss has to do with what is happening today.
From the New York Post this year: “The actual figure in academic research is a 37,000 increase for each percentage-point rise in the unemployment rate. It comes from a book called “Corporate Flight: The Causes and Consequences of Economic Dislocation” by Barry Bluestone, Bennett Harrison and Lawrence Baker.
“Corporate Flight” was published in 1982 and mainly had to do with companies moving operations overseas.”
The data was from 1981… so 39 years old. One study. Written, by the way, by left-leaning professors. Dealing with long-term job loss, not short term.
So do with it what you will.
@Truth not sure which data you are looking at to deny we have not seen a dramatic doubling and tripling of cases in the county recently. Just look at the hospital numbers and you will see a significant upward slope of patients. Might not be a Thanksgiving surge but it is a surge from someplace – all I see out there in the public is denial and lack of consistent safe practices.
Be safe, save all of us.
@Truth – Exponential growth in the cases may have started for CC county. I updated the graph at https://imgur.com/a/Tz5FnIq
Normally I have not been including the last 7 days for the new-case numbers. For today’s update to the chart I included three additional days even though the county may not have recorded all the cases for them as the counts for all three are much higher than the highest ever recorded for July’s surge. We are now seeing well over 500 new cases per day. We were seeing an average of 250 new cases per day in the week leading up to Thanksgiving day.
The number in the hospital is also now well above July’s surge. The good news is the ICU numbers have not started to climb and deaths are down.
WCreaker, I’m looking at the data right here on Claycord from the county. There has been no doubling let alone tripling of ICU or hospital cases from before Thanksgiving. They keep screaming the sky is falling but it’s still there just like it will be tomorrow.
@Truth – The county data shows that there has been a near doubling of the new cases, hospitalizations, and ICU numbers since Thanksgiving.
The 7-day average for new cases was 249.4 on Wed 11/25/2020. Since Thanksgiving the numbers have been:
As of Fri 12/04/2020 the 7-day average is 444.3. The county releases the updated numbers at 11:30 each day. Hopefully, the preliminary values don’t increase by much.
86 people were in the hospital with COVID-19 on Thu 11/26/2020 and it’s 143 as of 12/08/2020. That’s a 1.7 times increase.
21 people were in the hospital ICU with COVID-19 on Thu 11/26/2020 and it’s 39 as of 12/08/2020. That’s a 1.9 times increase.
The county data graphed at https://imgur.com/a/Tz5FnIq is worrisome as it shows that new-cases may have started an exponential growth phase. The hospital numbers will lag slightly behind new cases, ICU cases will lag slightly behind hospitalizations, and deaths lags behind ICU numbers.
Shutdown the virus, Spread the information. If you ever wanted to know more about treatments, and suppliments for Covid, here is a repository of scientific peer reviewed studies. The link below is vitamin D3 and the site has several more options and the studies to evaluate effectiveness it is Shocking. Stay informed Stay safe.
https://c19vitamind.com/
20 outbreaks in nursing homes? But masks work, right?
“33,654 fatal motor vehicle crashes in the United States in 2018”? But breaks work, right?
Wondering if you have a table to show deaths by age or age grouping?
This adding to numbers makes me suspicious. Are numbers added to meet the Narrative ?
More detail should be given since 99% recover from covid What are the ages of people who have passed? Did those who passed from COVID have underlying condition more answers please
HELP!! We are tripping over BODIES in the street!
THE SKY IS FALLING!
Here are some simple numbers to think about:
*Contra Costa County population = 1,160,099.
*270 of these people died from covid 19.
*135 of the 270 people that died were living in long term care facilities (LTCF) leaving the remaining 135 people deaths as Non-LTCF.
***So if you divide 1,160,099 by the 135 (Non-LTCF deaths) you will get only 1 death for every 8193 people. The government has no reason to shut down our economy!
Question: Contra Costa’s Cases Last 14 days shows as 3980 in table dated 12/9. However, if we subtract total of 11/26 from that of 12/9 to calculate 14 day cases, we get 28,391 – 23,571 = 4,820.
4,820 and 3,980 are off by 840! What gives?
Would appreciate understanding this better.
What gives….it’s people. So remember….”Soylent Green is people!”!
When my wife got her test back in August, she was told to expect her results in 19 days. As it happened, she got her results seven days later. Still, a significant number of test results don’t get reported to the County within the 14 day window. I believe the lag in reporting of some test results by the labs explains what you are seeing.
So we have not enough ICU beds, but spend hundreds of millions on field hospitals and staff to support it. John Muir hospital is building something behind back parking. Do you think new ICUs? Nope, they are building parking. What a logical choice in time of `pandemic` 😉
ICU capacity isn’t primarily about real estate. It’s about equipment and even more about staff with IC training.
Hospitals don’t operate with tons of highly trained reserve capacity sitting around waiting for a once in a generation surge in ICU patients. There’s a lot of hype and panic about Covid but this part is real: it doesn’t take that much to stretch hospitals thin. Especially if it is happening in many places at once.
@Avneet – I believe the problem is you tried to compare apples to oranges. When you did “Contra Costa’s Cases Last 14 days shows as 3980 in table dated 12/9” you were adding up the data for 11/18/2020 to 12/1/2020. That is 3,980 new cases which matches what you computed. You then tried to compare that 14 day range with 11/26/2020 to 12/9/2020 and arrived at a different number.
I suspect when you looked at the data download table you missed that they don’t include the last seven days in the table. While the download did not include 12/2/2020 to 12/8/2020 you could have pulled the data from the New Cases by Collection Day chart on the dashboard. Once you have that then the total of new cases from 11/25/2020 to 12/8/2020 is 4,359.
Another “gotcha” is that when subtracting one total from another that you need to use the previous day’s total for the first total. In this case, you should have subtracted the total for 11/24/2020 which was 24,032 from the total for 12/8/2020, which is 28,391. The difference is 4,359 which exactly matches what I added up earlier. (you were off by a day when you found 23,571)
Yet another “gotcha” is that you can’t use old county or Claycord reports for the older totals unless you are careful about what you are trying to compute. If you look at their report for 11/25/2020 you would see that Total cases (since March) is 23,381. However, that number, which is for everything up through 11/24/2020, will rise quickly as test results came in. The total back then is not the same thing as the total when you look at it today.
The county’s waiting seven days for the numbers to settle down is reasonable. Let’s look at 11/24/2020 where I will show both the total number of cases and the new cases for that day in succeeding day’s reports from the county.
Reports starting on 12/02/2020 would be the first day where the data from 11/24/2020 would be used for decision making. You can see that both the grand total for 11/24/2020 and the number of new cases for 11/24/2020 both have shifted a little over the intervening days. We can also see that it took six days for the bulk of the testing to be completed for samples taken on 11/24/2020. The jump from 265 to 274 on 12/09/2020 seems odd. It’s like nine more votes for Trump or Biden were found but it’s not enough to change the election’s outcome…