
This is the new COVID-19 daily update on Claycord.com:
-
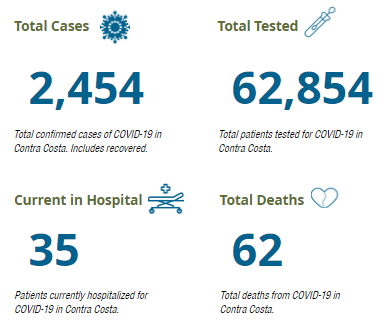
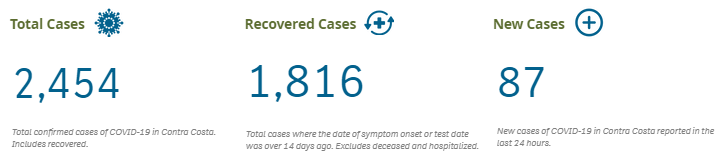
- 576 active cases of COVID-19 in Contra Costa County.
- 87 new cases of COVID-19 in Contra Costa County since yesterday.
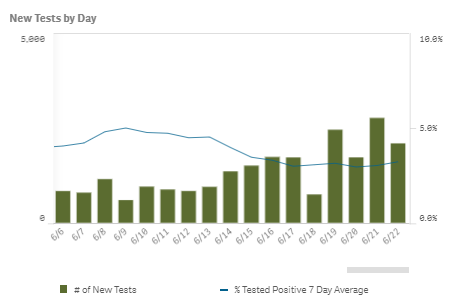
- 2,104 tests were conducted in Contra Costa County since yesterday.
- 0 deaths since yesterday.
- Only 1 person under the age of 50 (they were in the 31-40 age group) has died from COVID-19 in Contra Costa County.
- 41 of the 62 deaths have been people over the age of 81.
- 34 of the 62 deaths were in long-term care facilities.
- 236 people are hospitalized in the Bay Area with COVID-19.
The population in Contra Costa County is 1.1-million.
The number of outbreaks in long term care facilities (LTCF) is increasing.
There are now active outbreaks (at least two people testing positive COVID-19 in the last 28 days) for facilities in
City Res. StaffPittsburg <11 0
Pleasant Hill 44 34
Concord 68 28
El Sobrante <11 <11
Walnut Creek <11 0
Walnut Creek <11 <11
If a number is listed as <11 then it’s between 1 and 10. The county does this to protect patient privacy.
The only resolved major outbreak is the one in Orinda with 38 residents and 32 staff.
The county does not break out the hospitalizations or deaths per facility but instead reports the totals which are 238 cases of COVID-19; 35 hospitalizations; and 39 deaths. All three numbers are cumulative to date and include both residents and staff.
I wish counties were not “punished” for COVID-19 cases, hospitalizations, and deaths from LTCFs. All of us in the community could be wearing masks, social distancing, etc. perfectly and still have terrible numbers if there is a significant outbreak within an LTCF.
I also learned from Claycordian Sancho Panza yesterday that the county’s hospitalization number includes people from other counties being treated here and excludes people from CC county being treated elsewhere. Thus the hospitalization numbers are useless as a metric for how well or badly things are for CC county.
“Thus the hospitalization numbers are useless as a metric for how well or badly things are for CC county.”
Does this mean all the numbers are askew then for measuring if a county is doing good or bad? 🙁
I don’t think your information on the hospitalization is entirely correct. The hospitalization info in the Overview Dashboard reports two numbers:
1. Patients currently hospitalized in Contra Costa and County residents hospitalized in other counties. (Contra Costa residents)
2. Patients currently hospitalized for Covid-19 in Bay Area hospitals. (All patients in Bay Area hospitals)
@DLo – You are correct but it brings up that there’s more issues with the county’s presentation of the numbers…
https://www.coronavirus.cchealth.org/ has
https://www.coronavirus.cchealth.org/dashboard has
The latter page has a formatting issue where on many desktops the caption gets cut off. People likely don’t see all of the “County residents hospitalized in other counties are not included.”
To view the full caption you can hover the mouse over the “Patients currently hospitalized for COVID-19 …” wording on https://www.coronavirus.cchealth.org/dashboard
On June 18th Dr. Farnitano (Contra Costa County Health Director) said that some west county residents were being treated at hospitals in Alameda county. We don’t know how many exports they are. Dr. Farnitano also said that we are treating people from other counties as those counties were overloaded with patients while we currently have some available capacity. We don’t know how many imports there are and if they are included in the 35 patients being treated.
@WC Resident – thanks for the info. My definition was being cut off and I see now the whole caption by hovering.
The one additional think I would like for the County to provide is the number of resolved cases by city. I think it would give a clearer picture of where the hot spots are in the county.
Thanks for all of the information you have been providing. It’s been very helpful. Do you publish it on a website somewhere?
@WC Resident—you’ve connected the dots…bravo! Contra Costa County residents deserve data that is clear, concrete and scientific since all our mandated directives are based on such…
“The truth may be stretched thin, but it never breaks, and it always surfaces above lies, as oil floats on water.”—Miguel de Cervantes Saavedra, Don Quixote
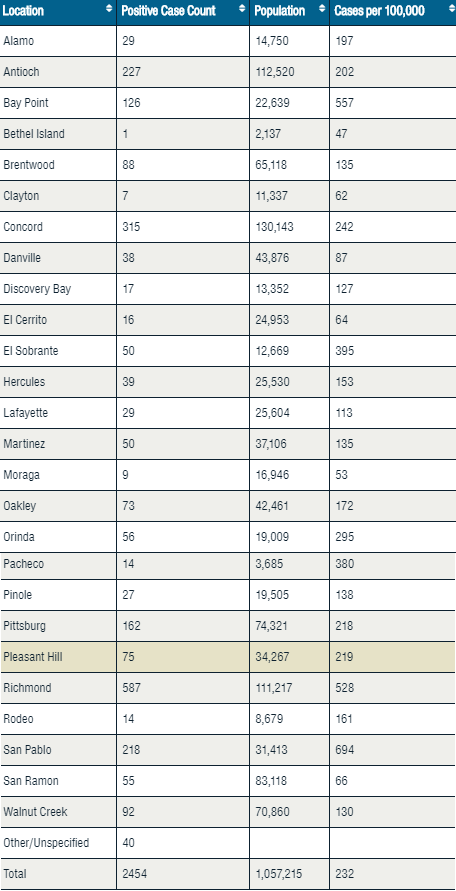
@DLo – The number of active cases on a per-city basis can be estimated by counting the number of new cases for the last 14 days and then dividing that by the (city’s population divided by 100,000). That will give an estimate of the the number of active cases per 100,000 population. Here’s the current list sorted so that the cities with the largest increase per 100,000 are at the top of the list. I included the county as a whole to serve as the baseline. The cities above that line are worse than average.
242 San Pablo166 Richmond
133 Bay Point
111 El Sobrante
109 Pacheco
84 Concord
71 Antioch
64 Contra Costa County
51 Hercules
51 Pittsburg
47 Oakley
41 Alamo
38 Walnut Creek
37 Discovery Bay
36 Pinole
35 Rodeo
32 Martinez
31 Brentwood
23 Danville
16 El Cerrito
13 San Ramon
12 Moraga
12 Pleasant Hill
9 Clayton
0 Bethel Island
0 Lafayette
-11 Orinda
Orinda is negative as the number of confirmed cases fell from 58 to 56,
Can we know the numbers in particular hospital s or care homes. ?
Claycord thank you for posting these updates by city. I hope you will consider posting daily. 👍
How many have died from Non-Covid flu/pneumonia this year?
Where are those stats?
@yoyohop – alot less.
Here we go again. The old lie! COVID-19 is not as bad as the flu or other infectious diseases! This disease has many other consequences! Like permanent heart and lung disease. Oh how about missing limbs.
Also we don’t have a pandemic oh the flu or pneumonia!! DUH
That is the problem because the hospital, care facility and who ever report the stats are using CV19 even people died with NON CV19 I don’t know why they keep using CV19 cause of death even people died of NON CV19. just dose not make sense.
I know two elderly people that have died from pneumonia in the last two months. Neither one tested positive for covid .
@Dan – a lot less than what? If your answer is a lot less than COVID-19, you miss the point of Yoyohop’s question.
News reports increase in young people in their 20’s getting it now, most likely the “peaceful” protesters aka rioters/virtue signalers. Good, they get what they deserve. They think they are safe because they are young but even if you beat it and fully recover it wrecks havoc on your organs. You will have more risk of long-term health issues such as Impaired lung function from SARS-CoV-2 infection can negatively affect other organs like the heart, kidneys, and brain, with significant health impacts that may last after getting over the infection. HAVE FUN! Enjoy your lifelong health issues for putting others at risk because of your behaviors and poor choices!
Who is Sancho Panza? Is this a fictional character?
We’re all fictional characters here. But most of us don’t get our own opera.
@ Carmen-
Sancho Panza is the sidekick to Don Quixote.
@ Cowellian
Great answer! I fear your subtle joke will be lost on most.
Ah…Man of La Mancha….one of my favorite musicals.
“The truth may be stretched thin, but it never breaks, and it always surfaces above lies, as oil floats on water.”—Miguel de Cervantes Saavedra, Don Quixote
Folks, we need to ask for transparency from our elected officials how data is presented…we at least deserve that…
Getting ready for SIP round 2!!!! I can’t say I didn’t tell y’all so!!! This Corona Crap ain’t no joke!!! Stay safe!
Many factors! Large groups gathering. Opening too soon. I am not going to get my haircut and I’m not gonna get my nails done for a long time because he’s doing that? Me. Not perfectly done but at least I feel better. It seems dumb for us to have to stay sheltered in place for three months and then they open up to soon now they’re going to close again and we will have to stay sheltered again. We all have COVID-19 fatigue
I bet. I just hope people will wise up and keep hand sanitizing, social distance and WEAR MASKS. Sick 😷 of saying this but there are still people who actually think The virus is a hoax and is getting better.
Thank you for posting the daily counts. Can you post the previous day like you did before.
What I’d like to know, and no one ever talks about is, out of the 62 deaths in CoCo county; how many have died wi
WITH C19 and how many have died OF c19.
I keep asking this same question and have no answer.
From what I’ve heard hospital get a large sum of money every time there is a c19 death, so of course it would be better to put on the death certificate that the person died OF c19 even if they died WITH the virus but not OF the virus.
STILL WAIT FOR A ANSWER. !!
If you ask that question in Colorado, you’ll get a detailed answer.
@snickerdad,
This question was directly asked at a CCC briefing and the director, Dr F refused to answer it.
Why can’t we hold are policy makers accountable?
Huge amount in Richmond. Still want transparency. County refuses to tell us where and how . They are doing contact tracing but will not tell us. Wouldn’t it be nice to know specifics?
The County won’t tell you which nursing homes have Covid cases? What is their explanation for not being transparent? You should call all of the local news casts to get a reporter to investigate the secrecy. I sure would. Hiding the locations of this deadly disease seems criminal.
@Puffandstuff,
Each facility is required to tell family members of the residents if there are any positive cases whether it’s an employee (such as is the case at Bayberry skilled nursing facility) or a patient/resident. I’d stand outside of the facility you’re considering for your Aunt and ask anyone who looks like a visiting family member what they know. Family/friends do visit regularly through windows. Please report on social media sites any locations you learn have positive cases. This information should NOT be kept quiet. This is a life and death situation, with many deaths being PREVENTABLE.
So they tested 2104 people and had a 87 test positive, roughly a 4% positive rate. I am not alarmed at all by the 87 new cases because there is not enough data to understand that number. We may have had less new cases recently but how many people were tested on those days? I personally am more interested in the 4% positive rate and where that falls on the spectrum.
@ILP
Keep wearing your mask and spouting your beliefs! Pop on dude!
The virus is NOT a hoax, but it IS getting better. =) The numbers of people who died or the number of cases will NOT go down, EVER. We need to look at the different numbers, like the positive test results. the number of beds occupied, etc …
This is all like we’re living in a science fiction movie or book from the 1960s or 70s. Many of those were warnings about how society could go wrong and totalitarian. If it is a ploy, then it is not working.
Look at WC Resident’s post.
People have been flown in from other counties as well due to their overflow.
Is this including the 13 dead and 75 (13 workers) that were from the San Miguel Villa?
The more tests given the more positive cases we will see
@Me – I don’t know.
The number of cases number seems to only include residents of the county. The problem with number of cases is the county fails to tell us why someone being tested. There are two main categories that, if known, would help a lot when interpreting the numbers. They are, was the person being tested symptomatic or not at the time they were tested? In other words, did they test to confirm that someone had COVID-19 or was this part of what amounts to surveillance testing of asymptomatic people? If we knew the number of tests and the results for those two groups it would help a great deal when trying to interpret rises and falls in the positive rate. There’s a third group which is testing of contacts of a known COVID-19 case but it’s a gray area as some contacts may have been be sharing a bedroom or sex life with the patient while others may be incidental at social gatherings or at work. I think it’s safe to include the numbers for these tests with the asymptomatic group.
The hospitalization numbers need to broken down into those that are residents of CC county, non-residents that are being treated here, and residents being treated outside the county. The first two numbers added together would be the total load on local capacity. The first and third numbers added together would be the hospitalization rate for residents. It would also be great to further break this down by age the way cases and deaths are.
I don’t know if the death numbers include deaths people from other counties being treated here or if they include deaths of county residents being treated in other counties.
As there are so many unknowns with the three main groups of numbers we in the public can only make rough guesses about how things are doing.
The county should also be releasing the numbers for deaths from all causes to put COVID-19 in perspective. This county report from 2010 says an average of “6,838 county residents died each year” between 2005–2007. That’s 18.7 per day. The county reports for COVID-19 start on 3/1/2020 which is 114 days ago. At 18.7 deaths per day that’s an expected 2136 deaths from all causes since 3/1/2020. This year there have been 62 deaths from COVID-19 since 3/1/2020 or 2.90% of all the estimated deaths using the 2005–2007 numbers.
That same document from 2010 also has the top-ten leading causes of death for the county which are:
Cancer 25.0%Heart disease 22.7%
Stroke 7.1%
COPD 5.4%
Alzheimer's 4.2%
Accident 4.1%
Diabetes 2.9%
Influenza/pneumonia 2.8%
Misc. diseases 1.5%
Homicide 1.4%
Guess what? COVID-19 has a very similar death rate as the flu!
The main difference is that it appears that if your case of COVID-19 is so bad that you are hospitalized that it seems you are one of the lucky ones if you die. If you survive then see What they don’t tell you about surviving COVID-19 on sfgate.
@WC Resident.
Thanks for continually putting up the stats.
I read the SFgate article and found it to be less than compelling.
Essentially it was a collection of hand picked anecdotes, from mostly anonymous people, many of whom had pre-existing conditions.
That the source material consisted of tweets, lends little to the article’s credibility. So much so that even the editor stated that it “makes no claims to their authenticity.”
The wide range of symptoms also raise suspicion.
And claims that “Everybody’s skin is weeping clear fluid and has sores and the skin just slides off with slightest turn or rub, all over the body.” seems dubious as hell.
If that description were accurate, wouldn’t you expect a much higher death rate from secondary causes like bacterial infection?
…and if you think for a second that sold out SF Gate will provide any actual truth in their articles, keep believing
It would be nice to know the total number of deaths recorded for the same period. The 7000 per year per million is actually about the same across the US plus or minus. So for CC County to have significant increase in deaths we would need like 200 deaths. You might recall Santa Clara County at one time talking about 20% increase in total deaths. Don’t think the data supports that. For the entire US the reported deaths are a much higher percentage of annual averages.
Show us some data!
My niece had covid 19 . She is 12 and has kaiser . They called their doctor and he said do not come in send me the pictures of her feet. So they did and he said yes she has covid 19 that is what it looks like but we will not send you for testing. No one in her family got it including 2 parents and 3 siblings. Just her. So our numbers are never going to be right because they are not testing patients who clearly have it.
@ ano where in the world would your 12 y/o niece have contacted covid and no one else in her family?
We have no idea. That is what is so crazy. Her parents are super great and they have kept her home even now that she is better. She got it back at the end of February
@ano….If my doctor diagnosed me with the CONVID19(kungflu) from a picture of a rash I had on my feet I’d find me another doctor….really fast.
That this happened back in February makes far more sense. At the time there was an extreme shortage of tests. Plus, there is no treatment or cure for COVID-19 meaning the medical advice given would be exactly the same regardless on if the niece had tested positive or not.
It’s probably dermatitis…unless she gets tested you cannot truthfully say she has it.. Get a new Doctor fast!
Lies, of course they will continue to play the controlavirus card, it will not stop, part of the globalist agenda to implement the new world order
You guys keep going back and forth with your bickering. There are two ways of dealing with this: panic, freak out, and treat everyone as though they are infected and are going to kill you and your family of rat dogs, or sit back and enjoy the show. I choose the latter. It’s been quite entertaining.
Soon, this too shall pass.