
This is the new COVID-19 daily update on Claycord.com:
- 498 active cases of COVID-19 in Contra Costa County.
- 218 people are hospitalized in the entire Bay Area.
- 34 of the 62 deaths were in long-term care facilities.
The population in Contra Costa County is 1.1-million.
Thank you for posting this chart
Yes, thank you, Mr. Mayor. Appreciate your making it easier to track daily changes.
Thanks for posting…
We were doing so well. Concerning to see the jump in numbers. At Costco yesterday there’s just people on top of each other. It’s not right.
Many of the people that shop there work with the elderly also.
Bet no one washes their hands anymore. I am distressed by all the scrubs worn out in public to get discounts and then return to care for patients in same scrubs. Total ignorance
@Aunt Barbara I don’t think that people wear scrubs out in public to get a discount. I’m pretty sure Costco or pretty much any other store DOES NOT offer discounts. Also, you may be seeing a lot more people out in scrubs because a llot of admin jobs at dental offices, eye doctors & other places now require employees to wear scrubs. These are people who are probably on their way home from ACTUALLY working at their J.O.B. and don’t have the time or luxury to stop at home & change before going shopping. Your assumptions are completely ignorant!
Your assumptions are ignorant, mine are the facts. I asked and they said they were on their lunch break from John Muir and a few from Kaiser. I did not say they were at Costco, read post, don’t assume! .
They are running out to lunch and yes many places give discounts to healthcare workers. look at the posted signs!
Scrubs should never be worn out of the hospital, they are sterilized for a good reason.
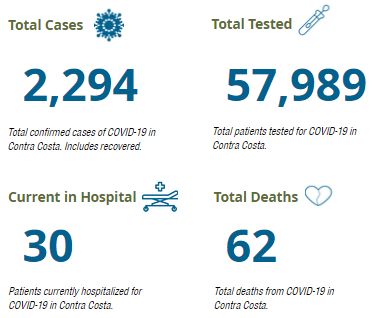
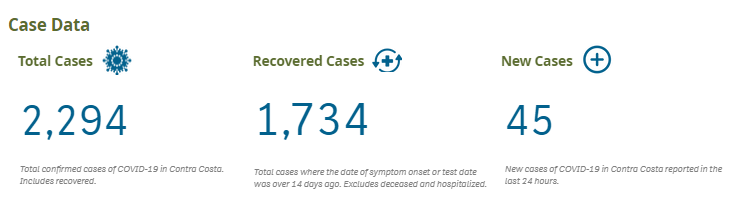
as of 06/21 @ 11:50am:
2,294 confirmed cases in CCC with 62 deaths = 2.70 death rate.
correction: that’s at 11:30am & 2.70% death rate.
Hold up Rain Man I think your stat is wrong. Your death rate is for those that have tested positive and does not include those that have not been tested, but have been infected.
A more accurate death rate calculation would be the following:
-Total Tested- 57,989
-Percentage of those tested that are positive (2,294) = 3.95%
-Assume that approximately 3.95% of CCCounty (1.154 million) is infected. Total infected =45,583
-Out of total infected there are 62 deaths.
-Death rate of those that are infected= .00136%. Less than 1%.
As we live quite close to Carlson And Aegis – MANY years now, I can assure you we have seen Ambulances ALL the time. AND Have so ever since they moved in. The death by Covid itself is still VERY low in CCC. IF anyone dies from these assisted care facilities and TESTS “positive”…. It is listed as A Covid 19 death. SO, No one ever dies in these places before this “FLU”?? My niece is An EMT and does drops many times for John Muir. They are getting more overdoses and self-harm cases in the last 45 days than she has Ever seen in 5 years! hmmmm????
I’d sad call volume is back to what it once was. Which is very busy. But there are still new elderly people in other facilities getting newly diagnosed with covid.
But there are also regular people out and about who get a positive test still. In JUNE.
My mother lives in an assisted living facility and almost everyone there has a DNR (Do Not Resuscitate) form posted in their room. My mother isn’t afraid to die, she is afraid to live long enough to be completely deaf (she is getting close), blind (already 20/800 in one eye) and bed-bound (can still use a walker). And to your point, even though all residents are required to get a flu vaccine, a lot of residents “Move out” between November and February.
Very few people have been diagnosed with cancer, heart disease, diabetes, etc…in the past 4 months… and yet our state and county health officers are strangely oblivious or perhaps just indifferent to the damage many people will suffer from delayed diagnosis and treatment of non-coronavirus ailments.
Agree 100 % !!!
Summer heat bring more deaths of the elderly too. You’ve all noticed the articles warning of summer heat problems and the effect on the elderly.
There is a pandemic.
Roughly 80,000 people die from the flu every year and why are we shutting down the country for Covid? Makes no sense! Last time I checked we lived in a free country right?
Free country because we all agreed to live by the laws established by our elected officials. So that means following the orders from the Health Department who gets their direction from our elected Board of Supervisors.
And please do so as the rest of us want to stay healthy!
Maybe because by Kauai Mike’s calculation of the death rate, if we let it spread unchecked there would be well over a million dead in the U.S.
I’m not good with numbers so I appreciate everyone helping me out with statistics. A random google search: WebMD lists 8,2000 to 20,000 flu deaths a year normally. Facebook today shows 119,719 deaths. If the deaths being counted are from Jan-Jun, HALF a year, then that to me is a fearful lot more than the normal high count of 20,000 per year. I’m a Sr Citizen, and that’s why I stay home as much as possible.
Correction: well over 10 million dead in U.S. if unchecked.
You honestly see no difference in 80,000 over an entire year to 117,000 in a couple of months. Now do the math and see how many that would be over an entire year if we had done nothing. 100,000 dead every couple of months……for 12 months. Get it?
“Free country because we all agreed to live by the laws established by our elected officials.”
That is a startling misunderstanding of the concept of freedom.
This is called a pandemic. We all must keep following all mandates to keep this virus under control. This is not to be compared to the flu. This virus can leave people with serious damage to other organs if they survive COVID. We may have to shut down if this spikes up to dangerous levels. So we must not develop COVID fatigue! No lazy behavior. Wash your hands, wear your masks and practice social distance. The virus is like the big bad wolf only we can’t see it. Please follow the rules to make us all safe.
We are at 120k dead Americans.
We will hit double the worst flu deaths in just a matter of months from the start of the virus in the country. Heat was supposed to tamp it down. It’s June.
Dunno what anyone expects anymore. I get it. Trump voters hate Democrats, yada yada. But the virus doesn’t care. It won’t vote, and it won’t discriminate.
So folks can keep insisting it’s just the flu. You can keep insisting everyone telling you to wear a mask is a soyboy or chicom or whatever. 120k dead Americans so far, with more on the way.
You want our economy back? You want folks to stop being scared? There is no economy, there is no being back to normal as long as millions in the country keep insisting that 100’s of 1000’s of American deaths is just the way it goes and we need to give up.
What the hell happened to American Exceptionalism?
Yes, Greg, the “oh well!” attitude of so many careless people is beyond shameful. Until they lose a close relative they just wont give a damn.
Thanks for bringing this back – I have been tracking for months – this saves me looking it up everyday.
Thank you for posting
If you can go to Costco and the grocery store the mall and riot in the streets you can stand in line to vote absolutely no cheat by mail. The dream of the Democrats
Just require masks and have the voting machines outside while everyone maintains social distancing. It would be easily achievable (given no rain or insane winds) and an easy solution.
If you wish to stand in line during a pandemic to vote, you go do you.
I’m gonna fill out my mail in ballot. That’s how America rolls. 😉
Just wait for a Ballot Harvester to knock on the door.
You can give him/her your ballot and it will have a 50/50 chance of being counted, depending on which party the harvester is working for.
Remember, dirty tricks are the rule this year!
Thank you for posting these numbers. It’s especially important right now as we see the numbers increasing as we open up. I appreciate this information.
Folks, we need to dig to find transparency in these numbers. I just watched the 6/18 Ad Hoc Committee for Covid-19 and according to Dr. Farnitano we are importing Covid-19 patients from Imperial Valley as their health system is over whelmed (interesting he doesn’t give concrete numbers). We have 6 new deaths..is our county being tallied for hospitalizations/deaths of Imperial Valley citizens? Also, he clarified that there ARE patients that have had repeat tests that are positive, which bump up the numbers. Here’s the link if you are interested in watching:
http://contra-costa.granicus.com/MediaPlayer.php?publish_id=acf6dd3d-b1ba-11ea-888f-0050569183fa
The “Science” is settled until it isn’t settled, and then we get “New” science and then repeat. The reporting and statistics of coronavirus cases in this nation are so flawed, so corrupt, that Al Capone would be ashamed to foist these off on people. Some people want to prevent the public from concluding that “Cower-in-Place” was a disaster to our economy and the health of our citizens.
At least 2,000 people should have been diagnosed with cancer in our county during this time, not to mention, stroke, heart disease, diabetes, etc…Dr. Farnitano never addresses this issue, nor places it in context to the supposed ‘lives saved’. We could have locked down nursing homes and assisted care facilities, let the ‘immune-compromised’ cower-in-place and let everyone else go about their business and we’d be miles ahead.
BTW- Western Europe is opening. Sweden didn’t experience the predicted death toll, although their care homes weren’t protected as well as they should have been.
@Sancho,
Thanks for providing the link to Dr Farnitano’s briefing.
Here are my observations:
1) The format of the briefing allows Dr Farnitano to selectively dodge questions from the public.
2) A question that Farnitano artfully dodged, was whether someone who dies WITH Covid is automatically counted as a Covid death. Would a person with Covid who was hit by a bus, be a Covid stat too?
3) He confirmed that someone who has fully recovered from Covid will continue to test positive.
4) He provided very little statistical data. When asked to clarify the age demographics of the hospitalized, he basically said that the demographic data is similar to everywhere else in the world, so just go look it up yourself.
5) Basically he rehashed state and county guidelines and monotonically mumbled trite BS like “wash your hands” and “keep 6 feet apart”. Only difference was that he had a lab coat, a comb over and looked like nerd.
Dr Farnitano ignored the critical questions or gave half-hearted answers, saying things like: Its about balance.
At best, this briefing was a token attempt at transparency.
Why are we not allowed access to the officials making policy?
This is not how a democracy is run.
Chuckie try again on Sweden – deaths per 100K is 50 putting it in the Top Ten countries world wide. US is 37 per 100K……
Appreciate the link to these archived meetings. Firsthand information is valuable.
@Yoyo—You are spot on with your synopsis of the briefing! It’s difficult to watch with all the ‘ums’ but it at least gives you the opportunity to decipher some of the hieroglyphics, using your own deductive reasoning.
According to Mercury News we had the most ever reported daily new cases yesterday — 92
@ sancho panza. You are correct . Newsom brought in illegal immigrants with covid to be treated in the US , which is why Imperial Valley is so inundated. So to alleviate the system down there, Newsom had them spread out over CA. These numbers are not correct. The numbers include people who have recovered. In other words, they tested positive for antibodies , which means they have HAD covid sometime in the past. Covid has been around longer than they thought. They are pushing physicians to put covid as a cause of death. Did the patient die from covid or with it and from something else, there is a difference. Dr. Dan Erickson , an emergency physician, held a press conference about this. You can google it. Farnitano is a bought and paid for puppet, He does and says what he is told.
Thanks, America! Yes, I did have the pleasure of watching the Bakersfield Doctors news conference before it was pulled…you have to use your deduction skills to make any sense of all the nonsense.
POST DELETED
Please Note: Users who use multiple names will be deleted. Please choose one name so others can easily chat with you.
POST DELETED
Please Note: Users who use multiple names will be deleted. Please choose one name so others can easily chat with you.
Thanks for bringing this back!!
Can you also post the chart that has the cities # on there? I like to see the growth day over day. I don’t care about who’s recovered I’m just wondering about the day over day spread! Because I just found out about a whole bunch of people coming down with it. So it makes me wonder about everyone else. Thanks!
The last Claycord update with the by-city numbers was on June 13th, reporting on the numbers for June 12th. Here are the numbers since then.
City 6/12 6/13 6/14 6/15 6/16 6/17 6/18 6/19 6/20Alamo 25 23 23 23 24 24 24 24 26
Antioch 153 156 157 168 175 181 190 212 212
Bay Point 110 111 110 111 114 119 120 120 122
Bethel Island 1 1 1 1 1 1 1 1 1
Brentwood 71 72 72 74 74 75 80 81 82
Clayton 6 6 6 6 7 7 7 7 7
Concord 228 237 242 246 259 263 266 272 277
Danville 31 32 32 32 32 33 33 34 34
Discovery Bay 12 12 12 13 13 13 13 14 17
El Cerrito 14 14 14 14 14 14 14 14 13
El Sobrante 40 41 42 42 41 42 43 46 49
Hercules 32 34 34 34 34 36 36 37 37
Lafayette 29 29 29 28 28 28 28 28 29
Martinez 40 41 41 42 43 44 44 46 46
Moraga 7 7 7 7 7 7 7 9 9
Oakley 52 54 55 56 58 59 60 64 65
Orinda 58 57 57 57 56 56 56 56 56
Pacheco 11 11 12 13 14 13 13 13 13
Pinole 21 21 21 21 21 22 22 23 23
Pittsburg 130 131 134 137 140 145 146 151 153
Pleasant Hill 72 72 73 73 73 73 74 74 74
Richmond 451 462 470 484 496 500 510 535 561
Rodeo 12 12 12 12 12 12 12 13 13
San Pablo 160 166 170 174 177 181 184 198 206
San Ramon 46 47 47 47 48 49 50 52 53
Walnut Creek 70 70 72 74 72 74 74 76 76
Other/Unspecified 39 40 38 37 38 40 41 40 40
Total 1,921 1,959 1,983 2,026 2,071 2,111 2,148 2,240 2,294
WC Resident,
It would be nice if they posted the raw data. I’m particularly interested to know the demographics by day. Young? Old? Any groups over represented?
@Bad Nombre – HIPPAA likely prevents the release of the raw data.
I saved the demographics by day on 5/11/2020 and have been saving them daily since 5/17/2020. That’s how I have been able to generate the weekly summaries on the ages of the cases and deaths that I have been doing on Sundays.
I have been thinking of moving the data to a Google docs sheet to make it more available to others.
This pandemic has been around long enough that more and more researchers are saying “wait just a minute here”. Yeah, it looks like books have been cooked as some of you suggest. I’ve wondered about that all along. To understand this event fully you need to recall what was even in the mainstream financial press the last two years and what they were warning about. Try putting two and two together.
I think we all know the books have been cooked and the figures they put out are useless. However, if there has actually been a spike in new cases all over the Country ….. no one sees any connection between thousands of people rioting for days and a spike? Let’s see.. who was it that encouraged the rioters? Things were getting back to normal and the stock market was going up. Then, Oh noes – a spike in the virus! We may have to lock everyone down again for their own good – and crash the economy again just to make sure. Sure – just a coincidence.
I updated the chart of tests vs. active cases that’s at https://imgur.com/a/RSQK6hP
Active cases continue to climb. It’s at 498 at present and so not quite off the chart which I have scaled at zero to 500 at present.
The county is constantly adjusting the numbers for previous days as test results and other data come in. The one day spike of 93 new cases yesterday has been updated to that it was a spike to 103 new cases.
This may be an outbreak at a long term care facility that has not been added to the LTCF dashboard yet. I’m also wondering if it’s an outbreak at a jail as a wide mix of cities was impacted but predominately it was people from those cities whose citizens end up in jail at a higher than average frequency…
Some of the comments are claiming the spike is from “imported” cases. That’s not how it works. If someone who resides in another county is tested or treated in Contra Costa county then they are counted on their home county’s COVID-19 reports and not CC county. If someone who resides in CC county is diagnosed with OCVID-19 they will show up on CC county’s numbers regardless of where they were tested and/or treated.
Here’s the summary for the seven days from 6/13/2020 to 6/20/2020:
Age 20 or under increased by 57 cases which is 17.0% of the total increase.Age 21 to 30 increased by 64 cases which is 19.0% of the total increase.
Age 31 to 40 increased by 65 cases which is 19.3% of the total increase.
Age 41 to 50 increased by 65 cases which is 19.3% of the total increase.
Age 51 to 60 increased by 38 cases which is 11.3% of the total increase.
Age 61 to 70 increased by 25 cases which is 7.4% of the total increase.
Age 71 to 80 increased by 10 cases which is 3.0% of the total increase. There were 2 deaths in the past week in this age range.
Age 81 to 90 increased by 6 cases which is 1.8% of the total increase. There were 13 deaths in the past week in this age range.
Age Over 90 increased by 6 cases which is 1.8% of the total increase. There were 3 deaths in the past week in this age range.
The total increased by 336 cases. There were 18 deaths in the past week.
Here are the numbers for the year for Contra Costa County.
Age 20 or under has 283 cases which is 12.4% of the total cases.
There have been no deaths in this age range.
Age 21 to 30 has 377 cases which is 16.5% of the total cases.
There have been no deaths in this age range.
Age 31 to 40 has 402 cases which is 17.5% of the total cases.
There has been 1 death in this age range which is 1.6% of the total deaths.
The death rate for this age group is 0.2%
Age 41 to 50 has 409 cases which is 17.9% of the total cases.
There have been no deaths in this age range.
Age 51 to 60 has 342 cases which is 14.9% of the total cases.
There have been 4 deaths in this age range which is 6.5% of the total deaths.
The death rate for this age group is 1.2%
Age 61 to 70 has 230 cases which is 10.0% of the total cases.
There have been 7 deaths in this age range which is 11.3% of the total deaths.
The death rate for this age group is 3.0%
Age 71 to 80 has 124 cases which is 5.4% of the total cases.
There have been 9 deaths in this age range which is 14.5% of the total deaths.
The death rate for this age group is 7.3%
Age 81 to 90 has 84 cases which is 3.7% of the total cases.
There have been 25 deaths in this age range which is 40.3% of the total deaths.
The death rate for this age group is 29.8%
Age Over 90 has 40 cases which is 1.7% of the total cases.
There have been 16 deaths in this age range which is 25.8% of the total deaths.
The death rate for this age group is 40.0%
Overall, there have been 62 deaths from 2291 cases. The overall death rate is 2.7%
While the numbers are looking grim for older people keep in mind that nearly all of them were residents of nursing homes or assisted living facilities and so had more medical issues than those still able to live independently.
Thank you for your accuracy and thoroughness, WC Resident.
Cool bro, now look at long term effects of SARS-1 on people who suffered it, they all have permanent lung damage and are on disability and completely unable to work. This is a completely unstudied disease and it makes sense to diminish its spread as much as possible until a (SAFE, RELIABLE, STUDIED) vaccine is produced in any reasonable length of time.
That’s good news that most of the recent cases are in younger cohorts, esp. compared to earlier. It suggests that our modest increase in cases and positivity rate won’t translate to a spike in hospitalizations and deaths.
@WC Resident-Thanks for your thorough update, much appreciated!
In regards to your statement that place of residence determines which county is tallied positive test and/or hospitalization for Covid-19, please cite your source. There is much ambiguity with this… several Contra Costa Ad Hoc meetings have discussed our citizens hospitalized in Alameda and alluded to counting towards their numbers. Since people are focusing on deaths and hospitalizations, shouldn’t these numbers be cut and dry? Here are the minutes from 6/18 meeting should anyone want to follow:http://64.166.146.245/agenda_publish.cfm?id=&mt=ALL&get_month=6&get_year=2020&dsp=min&seq=1629
Thank you Sancho Panza. That link to the board of supervisors meeting notes was useful.
I suspect both of us are right. I looked at things again and it seems that for hospitalizations that we do count the imports. For example, the “Current in Hospital” part of https://www.coronavirus.cchealth.org/dashboard has “Patients currently hospitalized for COVID-19 in Contra Costa. County residents hospitalized in other counties are not included.”
However, imports do not seem top be counted as COVID-19 cases in the county’s oer-city tally. The per-city breakdown on the dashboard has 41 total cases since March 1 in the “Other/Unspecified” category. I had always assumed this was used for county residents that live on county land that’s not in a city’s sphere of influence. That’s probably 90% of the land area of the county though probably is 1% of the population.
If those 41 cases include “imports” from other counties then we are treating very few people. As the “active cases” number is essentially the number of new cases in the last 14 days I looked at that for Other/Unspecified. There were 37 on June 7th meaning we have roughly three active cases in that category. Maybe all three are imports?
Dr. Farnitano’s remark about “Gradual increase in hospitalizations, from 12-13 to 24, not including West County residents in Alameda County hospitals” is also interesting. The published numbers are:
Date New Hosp6/13 38 22
6/14 24 23
6/15 43 26
6/16 45 27
6/17 40 26
6/18 37 23
6/19 92 25
As he was talking on the 18th he only would have known the numbers for the 17th or earlier or mid-day numbers for the 18th. The “new” column is the number of new cases and Hosp is the number in the hospital. I can’t line up Dr. Farnitano’s numbers with the published data but also see that his numbers fall into the middle of the data for those dates. There’s not a huge discrepancy. If we are exporting cases then it’s very few or are getting balanced out by imports from other counties.
It means that the numbers in the hospital in the county reports are less useful as we don’t know how exports and imports there are. Thus we can’t use numbers in the hospital as a metric for knowing if things are getting better or worse for the county.
@WC Resident—Thanks for looking over your data, again. If anyone could figure this discrepancy on how this data is managed, would be you. I’m not a mathematician or statistics expert, but with some regulatory affairs experience…these numbers do not jive and are improperly categorized.
I don’t want to believe it, but perhaps the “World Series” has been fixed……..With all the unbelievable technology we have today, somewhere there has to be a couple of college kids that can decode the truth and expose the worst politicians for what and who they are. Then we might see some American unity again. Or we can wear masks and watch people topple the statues of our forefathers…..You know, the ones who want to light the fuse…
Dude, you can be totally in favor of keeping every single damn statue up and standing and all those who would threaten them being prosecuted to the full extent of the law, and be in favor of masks.
Masks are for the common good at this time given lethality (approx 10X the flu) and high transmissability of this disease.
Toppling statutes by radical communist hategroups is heinously, ridiculous wrong.
Both of these can be true and are.
Thank you …ZZ… well written 🙂
The biggest factor in the increased number of positives is the massive increase in testing that has occurred in June. The average number of tests per day in May was 696. The percentage of positives in May was 0.025.
To date in June the average number of tests per day is 1,788. The percentage of positives in June is 0.021. Not really significant.
Really it’s because we are 2-3 weeks after massive protesting/looting/rioting/demonstrations which had millions of people huffing in each others faces with only a very low rate of mask usage. We are suffering a spike now due to that and with improper management of the disease we will suffer exponential effects.
The “in hospital” number is the most important statistic. Not too long ago it was down to only 9, but started increasing again.
The rise of hospitalization is the main concern.
Yes, agree 100%.
Cool shpiel bro. In the real world asymptomatic transmission is a proven fact and the lethality is roughly 10x higher than flu. Long term effects are completely unknown, reinfection potential unknown, immunity potential unknown. SARS-1 was hardcore and almost the entirety of those in its studies were unable to work long-term and ended up on disability, the studies are out there for you to read if you will take the time.
It is immoral and illogical to refuse to wear a mask when indoors with other innocent people who are wearing a mask to protect you. Even if you are young and healthy and it seems to pose no risk to you, you can be asymptotically spreading it to others and then they end up killing grandpop and grandmom and little Timmy with leukemia. All your butt has to do is wear a simple, light, barely-there mask while doing your shopping for the 5 to 50 minutes it takes to get it done. It’s a modest ask for the health and vitality of your nation, which I am willing to bet you will claim to love.
The pandemic is real! This is not a political problem. We have a very serious virus that doesn’t care what you believe. We all have a responsibility to wear masks, wash our hands and to practice social distance to protect ourselves and others. This is not a hoax. The government is not making this up!! The entire world has been infected with COVID-19. Grow up and face reality. Stop making up lies to cope with the truth. Ignorance is dangerous.
My aunt is in the hospital after a stroke. We had to find a skilled nursing home for her. She has been tested and it was negative yet the nursing homes will not disclose to us if they have any positive cases at their facility. So we had to chose one in blind faith hoping for the best. Doesn’t seem right does it?
What an impossible situation to be put in. I wonder how many people have been faced with a similar situation here in Contra Costa. To me the lack of disclosure is criminal.
Thank goodness we have a makeshift hospital set up at the Pavilion. $600,000 a month!
The point Anon is there is no spike.
The MAIN reason for the spike is the protests, looting and all the chaos that was ALLOWED to happen. 100’s if not 1000’s of people packed next to each other, yelling and spreading their germs. Are you surprised we have a spike? We can’t do this, we can’t do that but sure go ahead, protest and destroy property and historical monuments. Now we see a spike and everyone is all of a sudden concerned and wonders why? Newsom got to go!
That is unbelievable to not be told of positive cases, so I’ll tell you that Bayberry SNF in downtown Concord just last week had a positive COVID-19 employee. Employees and patients will be tested starting today. At this time no one knows the extent of cases. Testing starts today. The rate at which COVID-19 spreads it should be illegal to hide the yes/no and number of positive cases inside these facilities. Call the CCCounty Health Department. Demand answers.
Also, you know they can trace the line of infection. They are not letting the public know. Plus, you know which side of the political line our city “elders” are aligned with. Sanctuary city? Exorbitant taxation? Benefits for illegals rather than take care of our own FIRST. Schools? A never ending blood letting of potentially capable, intelligent children. Steered towards the Kumbaya guilt.
@ Pat… thank you and I agree!
For the love of God people, relax. As people start getting exposed to other people cases will increase. We NOW know that it isn’t that dangerous for most of the population. Remember that your immune system works by being exposed to a lot of other germs. While sheltering in place, your immune system strength DECLINES as you weren’t being exposed to different germs. We “flattened the curve”; we aren’t going to get rid of the virus. It’s there. Some people will get it and be fine;others will not. Just like the flu or any other disease. Start taking care of your bodies – physical, mental and spiritual. If you are immunocompromised, then please stay home. Live your lives. Get healthy. Get empowered. You never know which day will be your last. THIS is not living people.