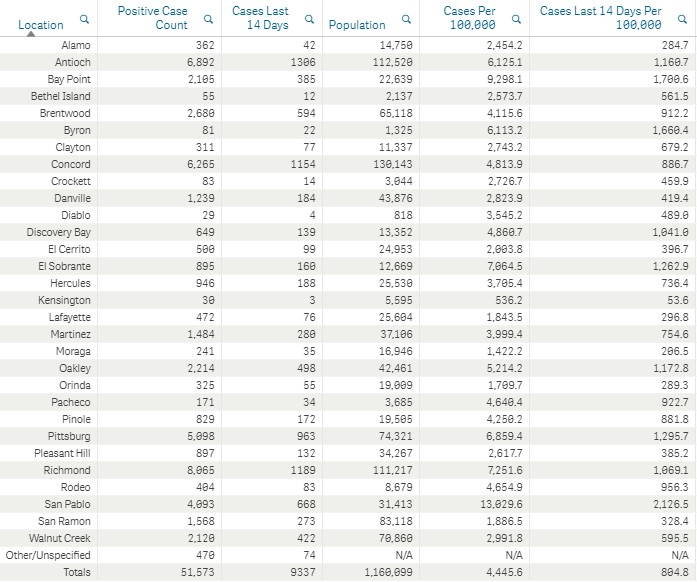
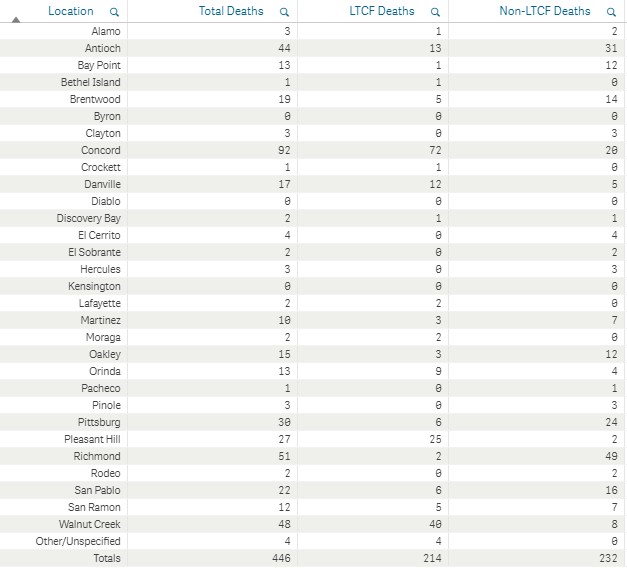
Contra Costa County COVID-19 data as of Saturday Jan.16, 2021.
All information is from the Contra Costa County Health Dept.:
- Total cases (since March) – 51,573
- Recovered cases – 42,978
- Deaths – 446
- Total active confirmed cases – 8,149
- One person under 30 years old has died (19-30 age range)
- 214 deaths in Contra Costa County nursing homes.
- There are currently 57 active COVID-19 outbreaks in Contra Costa nursing homes
Contra Costa County COVID-19 Hospital Data:
- COVID-19 patients currently hospitalized – 274
- Occupied ICU beds – 138 (57 COVID patients)
- Available ICU beds – 34 (11.8%) (Bay Area region is at 3.4%, according to the State of CA)
- Available ventilators – 168
PREVIOUS DAY NUMBERS SHOWN BELOW:
Contra Costa County COVID-19 data as of Friday Jan.15, 2021.
All information is from the Contra Costa County Health Dept.:
- Total cases (since March) – 50,627
- Recovered cases – 42,666
- Deaths – 430
- Total active confirmed cases – 7,531
- One person under 30 years old has died (19-30 age range)
- 208 deaths in Contra Costa County nursing homes.
- There are currently 61 active COVID-19 outbreaks in Contra Costa nursing homes
Contra Costa County COVID-19 Hospital Data:
- COVID-19 patients currently hospitalized – 257
- Occupied ICU beds – 138 (62 COVID patients)
- Available ICU beds – 34 (11.8%) (Bay Area region is at 4.1%, according to the State of CA)
- Available ventilators – 157


So, 11.8 = 4.1 ?
This is why I never supported “common-core” math and other fake-education methods. I’m guessing that state statisticians benefited from social promotion policies practiced in most school districts?
The 11.8% is for Contra Costa County, while the 4.1% is for the entire Bay Area. Before you attack the state’s math standards, double check what you read please. Have a nice day.
11.8% is for Contra Costa only, 4.1% is for the entire Bay Area. Totally different populations.
Care to comment on the fact we have 16 more deaths in Contra Costa from yesterday, only 6 of which are in nursing homes? Almost 4% of all deaths in Contra Costa County happened yesterday.
Or that the number hospitalized went up by 17 in one day?
Or that active confirmed cases went up by 618 in one day?
Or don’t those numbers matter?
How many of those additional 10 deaths were in a nursing home before dying in the hospital, and being tracked to it?
16 deaths in one day?!?!?
No, that’s 16 deaths reported in one day. Apparently the deaths need to be certified which delays reporting.
Here the dates of death for the 16 additional deaths reported yesterday. The Cy column is community and LT is Long Term Cara Facility (LTCF).
Also, for 01/01/2021 one death was shifted the community to LTCF columns.
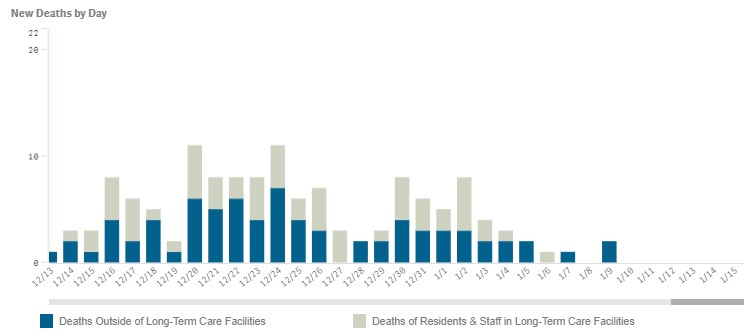
Here are the total deaths per day so far for December and January. These numbers are not complete or final.
Oops – here’s a repost with the columns aligned better. Hopefully Claycord will delete the previous post.
No, that’s 16 deaths reported in one day. Apparently the deaths need to be certified which delays reporting.
Here the dates of death for the 16 additional deaths reported yesterday. The Cy column is community and LT is Long Term Cara Facility (LTCF).
Also, for 01/01/2021 one death was shifted the community to LTCF columns.
Here are the total deaths per day so far for December and January. These numbers are not complete or final.
Can we address the fact that Newsom abruptly lifted the SIP on the Sacramento Region! With the fuzzy math (ahem, political pressure) suddenly that region is ok without the 3 week waiting period. This has to be looked in to further.
Nevertheless, my sweetie and I took advantage of the situation and went to a restaurant in Yolo County today and had an amazing time at an outdoor restaurant.
The Bay Area is playing the fool and our liberal local government are being played as puppets by our state government.
PS: check out how suddenly So Cal (who supposedly is lining up refrigerator trucks full of bodies) has approved King of Hammers in 2 weeks.
It’s like those “gun free zone” signs. Sacramento has been declared a “virus free zone” and so it’s open for business.