Contra Costa County COVID-19 data as of Monday Dec.21, 2020:
- Total cases (since March) – 35,322
- Total active confirmed cases – 6,576
- Recovered cases – 28,448
- Total tested – 754,541
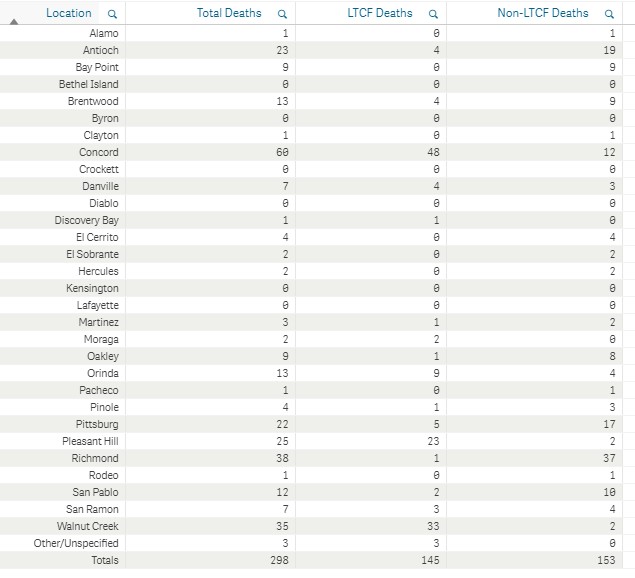
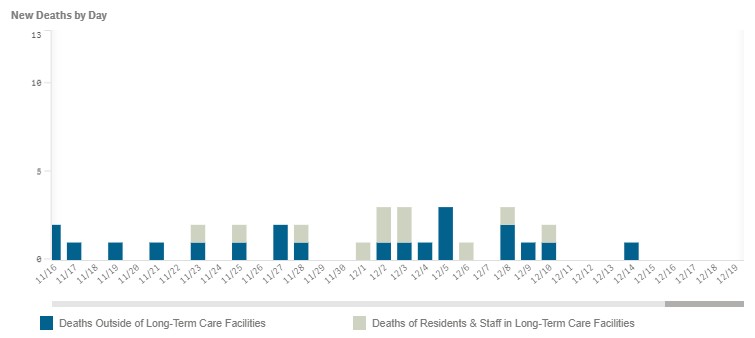
- Deaths – 298
- Nobody under 30 years old has died – 142 deaths in nursing homes
- There are currently 15 active COVID-19 outbreaks in Contra Costa nursing homes
Contra Costa County COVID-19 Hospital Data:
- COVID-19 patients currently hospitalized – 236
- Occupied ICU beds – 139 (55 COVID patients)
- Available ICU beds – 30 (11.5%)
- Available ventilators – 201
PREVIOUS DAY NUMBERS SHOWN BELOW:
Contra Costa County COVID-19 data as of Sunday Dec.20, 2020:
- Total cases (since March) – 34,918
- Total active confirmed cases – 6,475
- Recovered cases – 28,145
- Total tested – 749,384
- Deaths – 298
- Nobody under 30 years old has died – 142 deaths in nursing homes
- There are currently 16 active COVID-19 outbreaks in Contra Costa nursing homes
Contra Costa County COVID-19 Hospital Data:
- COVID-19 patients currently hospitalized – 228
- Occupied ICU beds – 146 (59 COVID patients)
- Available ICU beds – 24 (8.6%)
- Available ventilators – 182


Can someone explain the math to me on % of available ICU beds?
today our numbers are 139 beds occupied and 30 empty. Add those together and I get 169 beds. If I then divide 30 by 169, I do not get 11.5%, I get 17.8%.
Now someone may argue that it is 139 beds occupied, plus 55 for COVID and then plus 30 empty, that would total 224 beds total. Divide that by 30 and we get 13.4%.
So how are we getting 11.5%?
Sorry, you supply us data, I want to doublecheck it … and now I want to know why the county (I verified all these numbers on their website) is lying to us. The numbers for yesterday are off as well.
I did email the county, curious if they will respond ….
It’s basically COVID math by the State who is reducing capacity percentages if the number of COVID patients in the ICU exceeds 30%.
Here is what the Hospital Dashboard says on the County website – “The percent of unoccupied adult ICU beds is adjusted downward if the percent of adult ICU beds occupied by COVID-19 patients is over 30%. The ICU capacity is reduced by 0.5% for each 1% over the 30% threshold.”
Here is the math for today:
#Covid in ICU – 59/169=34.91% (exceeds 30% threshold)
Remaining ICU beds – 30/169=17.75%
Total ICU 139 x .045=6.25%
17.75%-6.25%=11.50%
@parent~ I’ve copied a reply to a post that I responded to about what was said at the 12/17 Board of Supervisors Covid update by Dr. Warne about ICU capacity:
Dr. Warne (Contra Costa Health Officer)spoke about ICU capacity yesterday and said the state is setting the statistic for our county—that it is ‘very flexible’ as the denominator changes from day to day and capacity shift to shift…that there are two criteria: licensed bed capacity and current staff capacity. I see all this data convoluted and we shouldn’t even bother with county stats anymore, we’re ‘one big’ island now and the Health orders will be mandated as such…
I know you are seeking concrete data but the powers that be are saying ICU capacity is continually fluctuating—
What a screwed up way to do math and capacity. Our Health Department should be ashamed, it they are the ones that brought us the instructions on how to have sex during the pandemic …. and have closed schools …. they have no shame or respect left.
Your first set of numbers that ended up with 17.8% is correct.
However, look at the end of the footnote that’s below the graph on https://www.coronavirus.cchealth.org/hospital. It has “The percent of unoccupied adult ICU beds is adjusted downward if the percent of adult ICU beds occupied by COVID-19 patients is over 30%. The ICU capacity is reduced by 0.5% for each 1% over the 30% threshold.”
Here’s the math, and I know you will say What the …!
59 COVID-19 ICU Patients
80 Non COVID-19 ICU Patients
139 Total ICU patients
30 ICU Beds Available
169 Total ICU beds
59 or 42.45% of the 139 ICU patients are there for COVID-19.
Subtract the 30% threshold and you get 12.45%.
Divide that by 12.45% by 2 to deal with the “reduced by 0.5% for each 1% over the 30%” ratio and you have 6.23%.
30 available of 169 beds is 17.75%.
17.75% minus 6.23% is 11.52% which the county rounded to 11.5%
If you do the math using only tenths of a percent you get 11.6% which is why I used hundredths of a percent in this example so that the math ends up with 11.5%.
There are 236 Covid-19 patients sick enough to be hospitalized. The sickest of the sick will go to Covid ICU. They could care less about some meaningless percentage.
The good news is that in the past 24 hrs 303 more people have recovered. 😊
@KT. I like the way you think. It would be nice to see the positive spin every day!
@Frustrated,
Thank you. I always look at the good. What’s sad is the media refuses to comment on the good; recovery numbers, negative numbers. I’ve call all the news stations in the Bay Area and KCRA in Sac and have asked the question on why not announce the recovery numbers and negative numbers and they become really defensive and have told me that it’s not in their agenda and hang up.
The media are all competing for your attention and cherry-pick the facts that inflate the story. Even the weather reporters look for the highest or lowest numbers. Instead of average wind they’ll substitute a peak gust. Channel 7 is especially bad with this.
Would it be possible to add death by age to the daily numbers? Kind of like the death by location chart but in groups of ages.
Are the deaths less of an issue for you if they are mostly older people? We know about half of them are in elder care facilities and that no one under 30 has died.