-
-
-
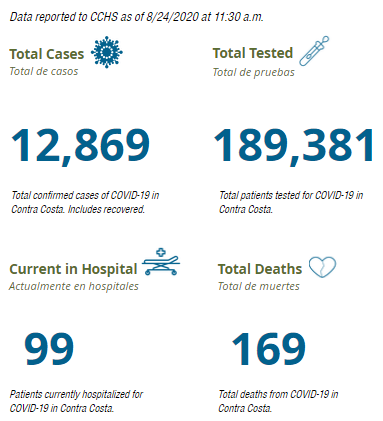
- 1,531 active cases of COVID-19 in Contra Costa County.
- 206 cases added to the total number of cases since yesterday in Contra Costa County.
- 11,169 people have fully recovered from COVID-19 in Contra Costa.
- 102 of the 169 deaths were in long-term care facilities.
- There are currently 35 active outbreaks of COVID-19 at Contra Costa County long-term care facilities.
- 89 of the 169 deaths have been people over the age of 81.
- 7 people under the age of 50 (two in the 31-40 age group, and five in the 41-50 age group) have died from COVID-19 in Contra Costa County.
- Nobody under the age of 12 has died from COVID-19 in the State of California.
- 1,240 tests were conducted yesterday in Contra Costa County. The seven day positive average is not available at this time, according to the county.
- There are currently 142 occupied ICU beds in Contra Costa County. 27 of those are occupied by COVID-19 patients. 55 ICU beds are currently available.
-
-
CASES BY CITY:
PRIOR DAY TOTALS:

The population of Contra Costa County is about 1.1-million.


If we divide the number of cases over the number of tests, we end up with a 18% positivity rate which is so bad that could demand a new shelter in place. Obviously, the positivity rate is not so big in reality, because people do not go to take the test any more. Clearly, a person who has a headache or a sore throat for one day will not waste time and energy to stay in line for testing and then wait 7 days or God knows how many for a useless result. Meanwhile, that person can infect many others.
You can read about a wedding in Maine where someone spread the virus to 50 people and led to the dead of one woman who did not attend the wedding at all.
The situation with the testing is deplorable. Soon enough we will reach the conclusion that we eradicated the virus. Which is totally false.
@Omega – I’m not sure why Claycord is not including it in their summary but the county still has a notice up “The State electronic system experienced delays in processing test results. Consequently, case and testing data is temporarily incomplete, and the positivity rate calculation is temporarily unavailable. We will remove this disclaimer when the situation is resolved. Click here for a detailed update.”
In summary – you will not get valid results if you try to do any math that uses the number of cases or number of tests. An 18% positivity rate is likely an example of an invalid number.
As it is, the public, and possibly county health authorities, have never been able to calculate the positivity rate. The problem is that some people are tested to confirm that they have COVID-19 while others are tested as part of survey screening. The first group will always have a very high positivity rate as they are people suspected of having COVID-19 and are tested to confirm this. The problem is we don’t know the sizes of the two groups nor the test results for each.
I meant death. Sorry.
More like 6.73%.
Every day we read that 60% of the CoCo County COVID-related deaths are in long-term care (About 53% of the CoCoCounty COVID-related deaths are over age 81). I thought they had no visitors allowed. How is this virus getting into those care facilities?
There are three classes of people that are still entering the facilities.
1) The employees or staff.
2) Vendors for the facility itself and medical people for the residents.
3) New residents.
Any of those three can bring the virus with them.
4) residents go to Dr. appts.
5) if they go to Dr. Appts with a family member, the family member may not bring them back immediately, but take them out for a meal
What I would like to know, how come the state STILL has not fixed it’s database and is unable to provide the 7 day positive average? With test results lagging and number of tests/day varying greatly, it is impossible to calculate the actual positivity rate. I’m beginning to suspect that we are being kept in the dark on purpose.
6) Residents go for walks outside the facility. Ideally they are socially distanced and masked walks. In early July I was taking a walk in Pleasant Hill and was near a LTCF. A staff member and resident left the facility and continued up the sidewalk on a walk. From what I recall, the staff person had a mask on and the elderly resident did not.
I suspect it was by coincidence but the very next day was also the start of a COVID-19 outbreak at that facility. The county has suspended detailed reporting on LTCFs but as of 8/15/2020, which was the last day they reported, there were 23 residents and 15 staff confirmed with COVID-19.
It’s possible someone at the state realized the same thing I have mentioned from time to time in that the current method for calculating positivity has always resulted in bogus results. It would be nice if there were fairly regular reports on issues with the numbers. The county has left the message about an issue between Kaiser and the state up on their dashboard since 8/12/2020. It makes me wonder if they forgot to take it down or if SNAFU has become the new normal.
The number of active cases has been out of sync with the number of new cases since the beginning of July. I suspect that’s due to lab processing delays. I posted a graph to https://imgur.com/a/pkLKsej
I would like to know Concord yesterday had 1631, today 1663 and increase of 32. But your charts show increase of 31. Why?
@Irving Lee – people answered your question on August 22nd at https://www.claycord.com/2020/08/22/daily-update-1531-active-cases-of-covid-19-in-contra-costa-county-91-people-currently-hospitalized/