This is the COVID-19 daily update on Claycord.com:
-
-
-
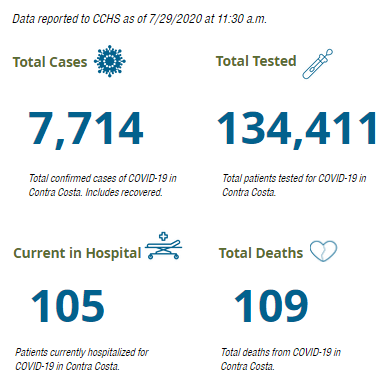
- 1,124 active cases of COVID-19 in Contra Costa County.
- 410 new cases of COVID-19 in Contra Costa County since yesterday (today’s total – yesterday’s total = number of new cases)
- 6,481 people have fully recovered from COVID-19 in Contra Costa.
- 81 of the 109 deaths were in long-term care facilities.
- There are currently 22 active outbreaks of COVID-19 at Contra Costa County long-term care facilities (seven more since Monday)
- 70 of the 109 deaths have been people over the age of 81.
- Only 1 person under the age of 50 (they were in the 31-40 age group) has died from COVID-19 in Contra Costa County.
- Nobody under the age of 17 has died from COVID-19 in the State of California.
- 1,038 tests were conducted yesterday in Contra Costa County. The seven day positive average is 8.2%.
- 550 homeless people are currently placed in motel/hotel rooms in Contra Costa County. Placements are approved for homeless people who are awaiting COVID-19 test results or those who are considered at high risk.
-
-
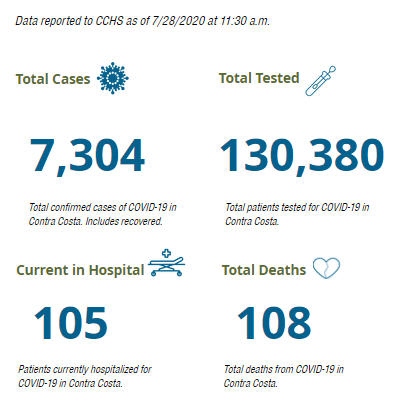
PRIOR DAY TOTALS:


The population of Contra Costa County is about 1.1-million.


Movin movin movin, keep them goalposts movin
There is something screwy with the death numbers on https://www.coronavirus.cchealth.org/dashboard. They were fine yesterday with 108 total deaths and the by-age table also adding up to 108.
Today’s release of the data has one new death bumping the total to 109 but the numbers in the by-age table jumped from 108 to 118.
Age 7/27 7/28 NewUnder 4 0 0
5 to 12 0 0
13 to 18 0 0
19 to 30 0 0
31 to 40 1 1
41 to 50 0 0
51 to 60 7 8 1
61 to 70 14 18 4
71 to 80 20 21 1
81 to 90 38 40 2
Over 90 28 30 2
Total 108 118 10
@WC Resident~
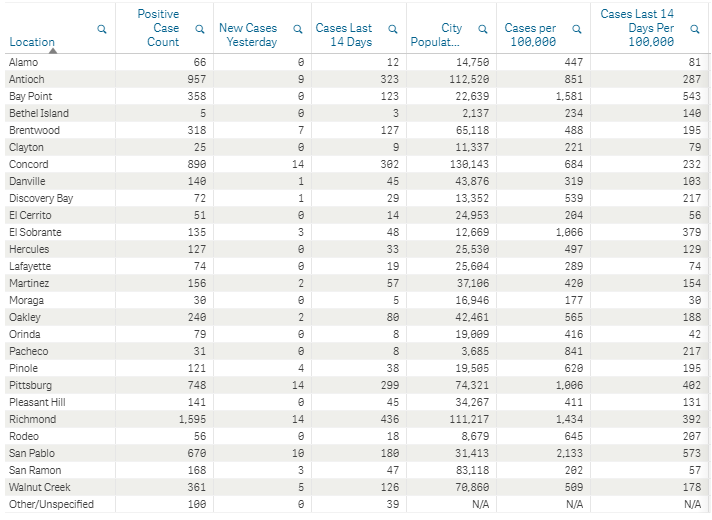
Thanks for your diligence in tracking these numbers! Yes, the death rate numbers should be crystal clear as some (like me) are tracking those trends, rather than positives. The CDC Covid site has 108 deaths for Contra Costa County, I noticed the dashboard finally has active cases noted for each city…bravo to them for providing that…
Wear a face covering when you’re out and about, keep 6ft apart, wash your hands regularly, stay home if you’re sick.
Simple, easy rules to protect yourself, your community and the economy.
Be part of the solution, not the problem.
BS..keep that con game moving.
@ BernieM
Ok Elsa, let it go. Haven’t you figured out by now people are going to do what people want to do.
Fine 🙂
Somethings wrong with you man. Have you seen the freeway? Life is going on full bore. You don’t have the right to tell another human what to do. You need to worry about yourself and your irrational fears. Mental illness is a thing. I never wash my hands and will never wear a mask for you. It’s called freedom and personal choice. You can call the mask police till the cows come home. But remember it’s against the law to make frivolous calls on people and you will be subject to lawsuits.
Yes it is my fault. I know it’s hard to see while shuttered inside clutching your mask waiting for the latest fearporn case numbers to tell you just how terrified you should be today, but the virus is done and the economy is booming..You think I’m spreading virus? How the hell can I spread something I don’t have? You mind telling me how that works in real life? The only thing I spread is reality. I know it sucks but deal
Totally agree Bernie. What so many on this site don’t get is that to have a healthy economy we need a healthy population. They go on and on about their rights, yea, that’s working really well. Look at the numbers out today, down about 33%, yet they’ll keep on not washing their hands, not wearing a mask that it unless, and until, they get infected. The problem will then be theirs except for those of us they infected while claiming to be patriotic, how intelligent is that? It’s not!
You’re implying our population is sick. I don’t agree. The numbers percentage wise says I’m right. Our economy is booming already. GDP is down as the county under gos restructuring. Stand by for lift off.
Kaiser Permanente is involved in testing one of the Covid vaccines. If you are interested what they doing, go to:
Kaiser Permanente is involved in testing one of the Covid vaccines. If you are interested what they doing, go to:
about.kp.org
Interesting – looks encouraging.
Interesting – looks encouraging.
Open the economy.
Let nature take its course. It’s natural and that’s a good thing, right?
Not sure if my last post went thru… if I’m reading correctly CCHS site reports 89 new cases. Which is correct?
The County reported 1,038 tests yesterday. They reported 89 new cases.
I realize that today’s total cases minus yesterday’s total cases should give the number of new cases, but that clearly doesn’t work. The previous case numbers are clearly being adjusted/corrected as time passes. Out of yesterday’s 1,038 tests, it’s not plausible that 410 of those tests came out positive.
I think I’ll stick with the 89 new cases number provided by the County.
Claycord reported 99 new cases on July 20. https://www.claycord.com/2020/07/20/daily-update-1093-active-cases-of-covid-19-in-contra-costa-county-70-of-99-deaths-have-been-in-long-term-care-facilities/?fbclid=IwAR2YJphjC7cHY2OLMc0nlsmaQCKZifez6-Jr2ZNhRCmcbmYa-RZm00w1ALA
The County updated the count on July 20 to 398 at some point (probably today). https://www.coronavirus.cchealth.org/dashboard
very interesting why all the social media sites have taken down the press conference of all the doctors that were talking about this covid-19 which I like to call the Chinese Wuhan virus. Let’s call it what it is
Thank you..and my head is about to explode with all of this mindless hysteria.
Xi coronavirus is the correct name. It’s a nod to the dictator, er I mean leader of Communist China. Anyone else want to swing the bat?
I personally know someone that took their life during this pandemic from the financial ruin and them being unable to continue getting the mental help they needed from childhood trauma.
I will never forgive any of you that support these lock downs. These suicides ARE ON YOU.
You mean the government? I’m pretty sure the people didn’t implement a lock down.
I am sorry to hear that you lost your friend. I have many friends and experienced more suicides when we were not in the pandemic. Let’s not point fingers. Let’s take action on treating mental health problems with love and care.
Claycord.. thank you for trying to explain.. I’m still confused🤔 Just hoping, like everyone else, we start seeing downward trend
@Frustrated…Not sure what you don’t understand, the “Mayor” made it as clear as mud, maybe WC Resident can stir in some more.
Mayor or anyone else,
Does anyone understand why the positive rate jumped so rapidly, and differs so greatly from the State reporting?
According to CC health, it was averaging 7.8-9 the past few days. State of CA website for our county says Contra Costa has positive rate of 4.8!
Such a large discrepancy in reporting makes me question accuracy.
Does anyone have insight?
Due to delays in getting test results combined data cleanup the county is constantly revising the numbers for previous days. The testing backlog is making the issue much worse. Here’s a table that shows the number of new cases reported yesterday vs. what the county reported today.
Date 7/27 7/28 Diff04/23/2020 18 19 1
06/01/2020 39 41 2
06/14/2020 28 29 1
06/23/2020 70 71 1
06/24/2020 69 70 1
06/27/2020 82 83 1
06/28/2020 165 166 1
06/29/2020 159 160 1
06/30/2020 115 116 1
07/02/2020 105 107 2
07/03/2020 141 142 1
07/05/2020 222 226 4
07/08/2020 108 109 1
07/09/2020 107 108 1
07/10/2020 166 169 3
07/12/2020 172 175 3
07/13/2020 205 217 12
07/14/2020 123 134 11
07/15/2020 89 92 3
07/16/2020 151 159 8
07/17/2020 141 145 4
07/18/2020 62 65 3
07/19/2020 134 143 9
07/20/2020 375 398 23
07/21/2020 185 195 10
07/22/2020 215 226 11
07/23/2020 196 223 27
07/24/2020 100 111 11
07/25/2020 151 227 76
07/26/2020 163 184 21
07/27/2020 149 216 67
07/28/2020 89
There were 89 new cases added for 7/28/2020 and 321 new cases added due to revising previously reported results for a total of 410 new cases that we know about. Both 89 and 410 are valid and correct ways of reporting the number of new cases.
I sure wish there was an easy way to explain this as I see from comments that it frustrates many people that the numbers don’t seem to add up.
@WC Resident…Maybe because the numbers are skewed, mis-reported, and most of all just BS.
It is just BS. Our elected and none elected officials just making us to believe they really care about us by forcing us to do useless steps to ‘protect ourselves and others’. That is so simple to issue an order and sit and do nothing. If numbers go down they say THEY did a good job by issuing this order, if numbers go up that is PEOPLE’s fault not wearing a mask.
Now look at number of outbreaks in Contra Costa County long-term care facilities overtime. I am sure they all are wearing masks there. Now answer the question ‘Are the masks effective?`.
What if we show these covid numbers along with others? Would we notice covid numbers at at all?
Our CoCo Health Dept. numbers have become a real moving target. There are revisions from many prior days occurring daily. It is really hard to believe anything they publish.
If my business had numbers being adjusted that fast and large daily a major audit would be occurring and heads would roll..
The numbers are accurate and based on the information known at the time. In the table in my July 29, 2020 at 5:42 PM post above the left hand column is the date people were tested. The labs are not able to immediately return the test results. As the test results are returned from the labs the number of cases for when the person was tested get updated.
If you are tested on July 20th and the lab processes the test on July 23rd and you test for having COVID-19 then the county will update the data row for July 20th to show one more case of COVID-19 was found that day. Likewise, the by-age, by race, by gender, by-city, etc. will all then be updated to show the new case.
Normally the labs are able to keep up with the workload and have the 100% of a day’s tests processed by the reporting deadline which is some time in the morning of the following day.
Folks~
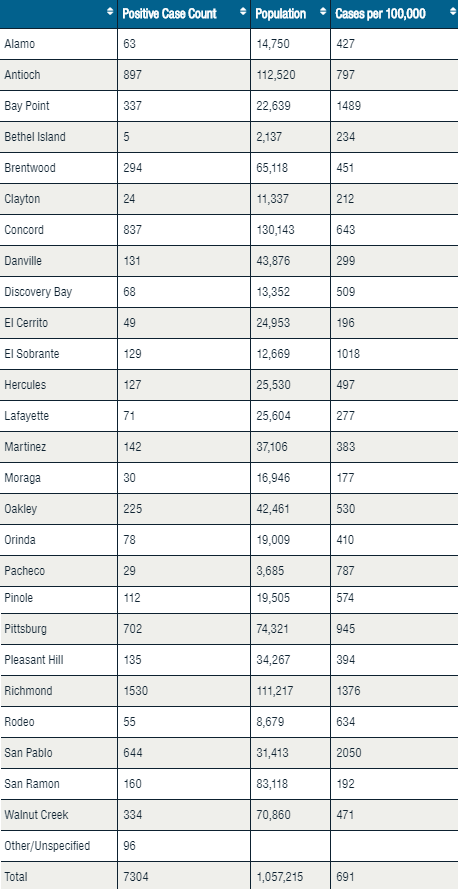
The Contra Costa County dashboard now has city break down of data such as cases, deaths and LTHCF deaths…take a look!
https://www.coronavirus.cchealth.org/dashboard.
The Claycord dungeon master is likely scratching its head over the latest batch of numbers from the county as today’s “daily update” brought to you by Claycord is running late.
There’s a note on the county dashboard “July 30, 2020 Note: The State reporting system had a glitch yesterday. Today’s numbers reflect the corrected data.”
Here’s a table for the number of new cases per day and what the county reported on 7/28, 7/29, and 7/30 for the calendar days listed in the table.
Date 7/28 7/29 7/30 Δ1 Δ1 Δ-net04/11/2020 8 8 9 +1 +1
04/23/2020 18 19 19 +1 +1
05/30/2020 25 25 26 +1 +1
06/01/2020 39 41 39 +2 -2
06/14/2020 28 29 28 +1 -1
06/23/2020 70 71 70 +1 -1
06/24/2020 69 70 69 +1 -1
06/27/2020 82 83 82 +1 -1
06/28/2020 165 166 165 +1 -1
06/29/2020 159 160 159 +1 -1
06/30/2020 115 116 114 +1 -2 -1
07/01/2020 85 85 87 +2 +2
07/01/2020 85 85 87 +2 +2
07/02/2020 105 107 106 +2 -1 +1
07/03/2020 141 142 142 +1 +1
07/04/2020 102 102 103 +1 +1
07/05/2020 222 226 225 +4 -1 +3
07/06/2020 217 217 222 +5 +5
07/07/2020 136 136 136
07/08/2020 108 109 109 +1 +1
07/09/2020 107 108 107 +1 -1
07/10/2020 166 169 169 +3 +3
07/11/2020 60 60 62 +2 +2
07/12/2020 172 175 172 +3 -3
07/13/2020 205 217 218 +12 +1 +13
07/14/2020 123 134 131 +11 -3 +8
07/15/2020 89 92 89 +3 -3
07/16/2020 151 159 154 +8 -5 +3
07/17/2020 141 145 141 +4 -4
07/18/2020 62 65 62 +3 -3
07/19/2020 134 143 134 +9 -9
07/20/2020 375 398 373 +23 -25 -2
07/21/2020 185 195 184 +10 -11 -1
07/22/2020 215 226 216 +11 -10 +1
07/23/2020 196 223 204 +27 -19 +8
07/24/2020 100 111 103 +11 -8 +3
07/25/2020 151 227 180 +76 -47 +29
07/26/2020 163 184 164 +21 -20 +1
07/27/2020 149 216 163 +67 -53 +14
07/28/2020 89 89 +89
07/29/2020 86 +86
Total 410 -135 +275
A net +275 for two days of new cases is in the right ballpark.
I suspect the data for 7/13/2020 will get adjusted again as it seems odd they add 12 more cases but then did not subtract it out. Other than testing backlogs that adjust the numbers for the most recent days, usually the adjustments have been up or down by one here and there.