This is the COVID-19 daily update on Claycord.com:
-
-
-
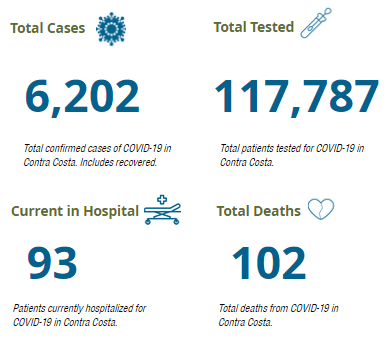
- 1,181 active cases of COVID-19 in Contra Costa County.
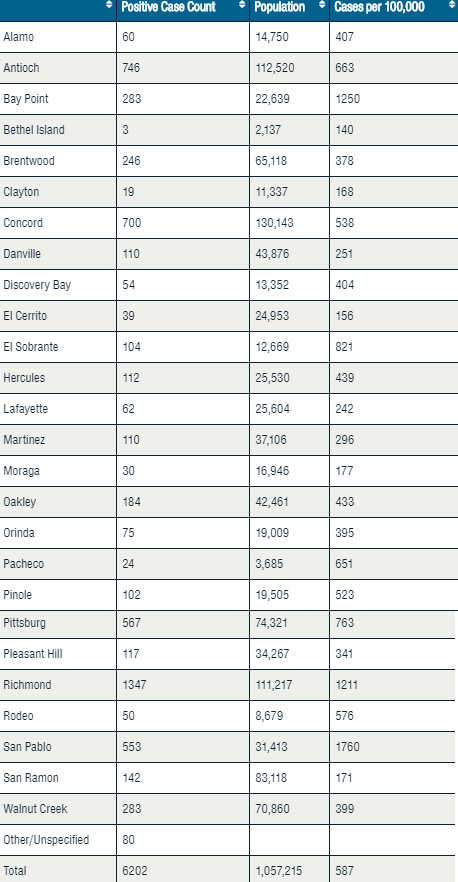
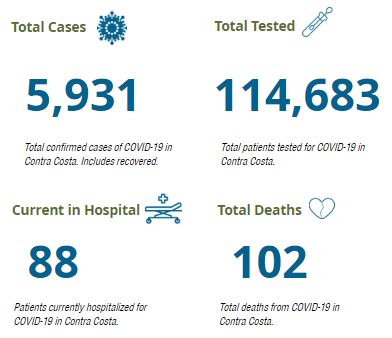
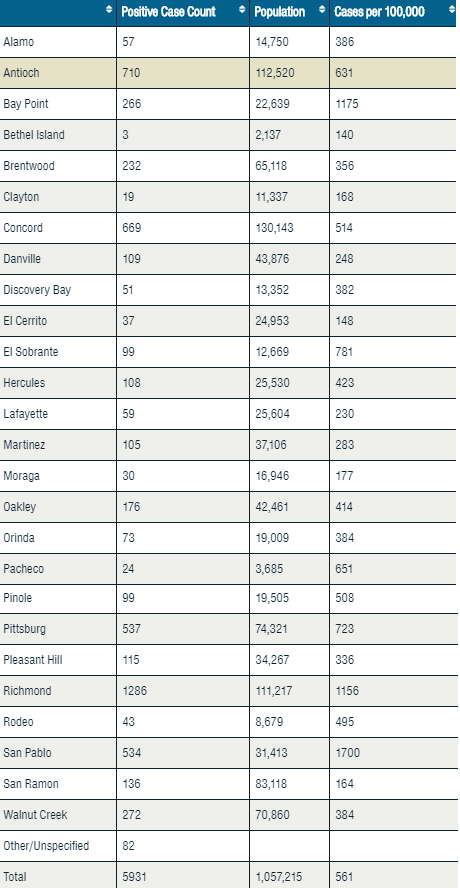
- 271 new cases of COVID-19 in Contra Costa County since yesterday (today’s total – yesterday’s total = number of new cases)
- 4,919 people have fully recovered from COVID-19 in Contra Costa.
- 0 deaths since yesterday (county total = 102).
- 71 of the 102 deaths were in long-term care facilities.
- There are currently 16 active outbreaks of COVID-19 at Contra Costa County long-term care facilities.
- 62 of the 102 deaths have been people over the age of 81.
- Only 1 person under the age of 50 (they were in the 31-40 age group) has died from COVID-19 in Contra Costa County.
- Nobody under the age of 17 has died from COVID-19 in the State of California.
- 2,938 tests were conducted yesterday in Contra Costa County. The seven day positive average is 6.1%.
- 552 homeless people are currently placed in motel/hotel rooms in Contra Costa County. Placements are approved for homeless people who are awaiting COVID-19 test results or those who are considered at high risk.
-
-

PRIOR DAY TOTALS:


The population of Contra Costa County is about 1.1-million.


It appears the testing backlog is creating large revisions in the numbers. For example the number of new cases for Mon 07/20/2020 were updated from 186 to 319 new cases for that day.
The increase of 271 reported today is in the community, or possibly a larger employer, and not a newly discovered outbreak in a nursing home. Here is the age breakdown.
Again the median age in the county is 40 so we are not far off on a normal distribution of cases by age. But the percentage below 40 has been increasing which shows that maybe us old folks are doing something right…
I am going to ask again. Are these just ‘tested positive’, or are they really sick..or somewhere in between. Otherwise as has been the case (pun) all along…pretty meaningless stats.
Nearly all of them either have no symptoms or are so mild they are told to stay home. About 7% of the active cases are in the hospital. The other 93% are at home. Even if you are in the hospital it does not mean it’s a critical case.
I wonder how many of these positive tests are follow up tests to see if the patient still is positive. A neighbor who works at a hospital indicates that follow up tests are not separated from new positives and could account for the increased percentage of positives.
Why am I not surprised …. SMH
Yep, a friends daughter is a nurse, and she said the same thing. If you test positive and get re tested as positive it counts in the system as two (or three, or four ..) separate people being positive.
It’s all a farce…
Time for testing Tuesdays at your polling place, every Tuesday. With contact tracing for new positives.