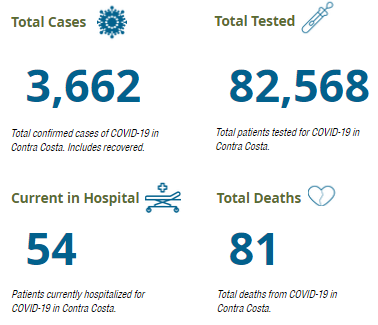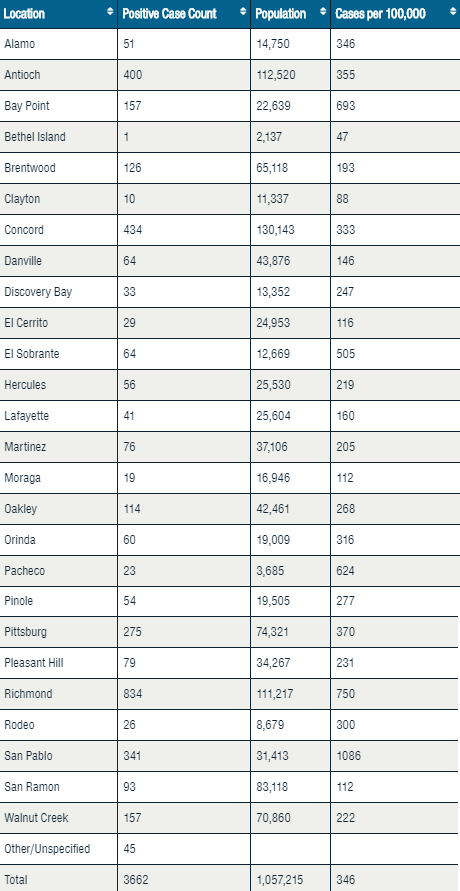
This is the COVID-19 daily update on Claycord.com:
-
- 1,022 active cases of COVID-19 in Contra Costa County.
- 101 new cases of COVID-19 in Contra Costa County since yesterday.
- 2,559 people have fully recovered from COVID-19 in Contra Costa County.
- 0 deaths since yesterday (total = 81).
- Only 1 person under the age of 50 (they were in the 31-40 age group) has died from COVID-19 in Contra Costa County.
- 56 of the 81 deaths were in long-term care facilities.
- There are currently 9 outbreaks of COVID-19 at Contra Costa County long-term care facilities.
- 1,912 tests were conducted yesterday in Contra Costa County.
- 539 homeless people are currently placed in motel/hotel rooms in Contra Costa County. Placements are approved for homeless people who are awaiting COVID-19 test results or those who are considered at high risk.

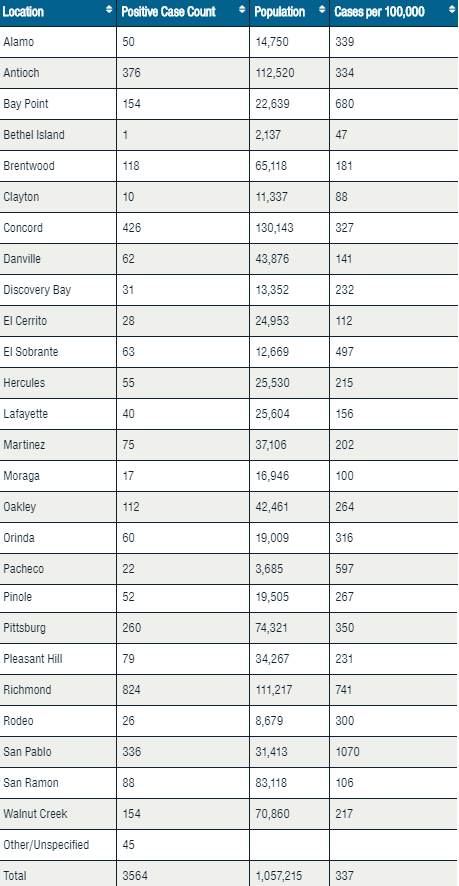
PRIOR DAY CITY TOTALS:

The population in Contra Costa County is 1.1-million.


For the week from Sun 06/28/2020 to Sat 07/04/2020 there were 857 new confirmed cases of COVID-19 and seven deaths.
By age, the breakdown is:
I have updated the chart of the number of tests vs. active cases at https://imgur.com/a/RSQK6hP
Here’s a table for the past few weeks that shows the number of new cases by week, active cases, and my estimate of the odds of running into someone with COVID-19. It’s not exponential growth but it’s close.
On May 23rd the odds of running into someone with COVID-19 in the community were about one in 5,000. Now it has dropped to one in 824. This is fueling an ever faster growth,
Fortunately, other than ICU beds, we have plenty of hospital capacity which is why the health department is not slamming things to a standstill the way they did in March.
Thank you, WC Resident for these tables, charts and comments. Appreciate the statistical perspective.
Thanks for your details and analysis. Insightful and appreciated.
Should be noted that 50% of the population of the county is under age of 40 so new cases in those ages are greater than average distribution.
The odds are higher then that. You can’t just go off the population because a lot of them are sheltering in place. Costco has people just on top of each other. Your odds would probably be 3-1 of running into someone.
Thank you so much WC Resident! This is so useful.
WCreaker, it should also be noted that most of the deaths are for those over 65+.
“On May 23rd the odds of running into someone with COVID-19 in the community were about one in 5,000. Now it has dropped to one in 824. This is fueling an ever faster growth”
WC Resident
@WC Resident,
Do you happen to know how the homeless positives are reflected in the city counts? Are they in the other/unknown count or are they counted where they are sheltered in the motels?
@DLo – I don’t know. My guess is that the address used varies from person to person. They won’t always be in the Other/Unspecified city for example.
@WC Resident – Great data, thx for posting. Telling the increase in percentage of overall new cases attributed to younger adults / younger individuals. Mary
Take care of our elderly and those with compromised immune systems. Life for the rest of us, business as usual.
@ZZ Exactly!
Take care of the elderly and those with compromised immune systems by distancing and wearing masks or other nose/mouth coverings.
May 25th – George Floyd
Massive rioting & looting
June 6th – 2 weeks later, COVID spikes upward.
Riots continue – Increase spike continues
Memorial Day gatherings, reopening of businesses – cases spike.
The interesting thing is that while a lot more people are testing positive now, deaths are actually going down. Could this be part of the needed process towards ‘ herd immunity ‘ ?
@badge1104 More cases this time are from young adults rather than the elderly. The virus affects the younger in less harsh ways than immuno-compromised or elderly. However, the deaths we have mostly seen at least within CCC have been from assisted living facilities that were inappropriately handling situations. SF Gate had an article on the incident with San Miguel Villa.
Statistically, this is no worse than a seasonal flu.
END ALL RESTRICTIONS AND LIMITATIONS.
130k people have died in 5 months.
I’m no doctor but maybe this isn’t the flu.
@ GREG
You haven’t heard by now that everyday regardless of cause has been a labeled a COVID death (see: Dr. Debora Birx) and thus it is grossly overinflated. The survival rate is 99.9+%.
So, yes, so basically a mild flu season.
Tired of seeing comments about spikes from holiday gatherings or businesses reopening but refusing to acknowledge crowds of hundreds to thousands protesting, or vice versa. Since human contact seems to be the common factor here, is it possible that both sides contribute to the spikes? It is a virus. It doesn’t care which way you lean, which side you root for, or who you choose to bump uglies with. Stop politicizing the damn virus.
People assumed as you do, but there have been no spikes in most of the cities where heavy protests were. Most of the protestors wore mask, and it was outdoors.
Houston is being decimated with viral load right now, and it’s all due to the rushed reopening.
Close contact with no masks indoors is what transmits the virus most effectively. This has been proven throughout Asia and Europe.
I am with you. It is all ‘family gathering bad but protests are good’.
@ Greg
Most of the protestors were NOT wearing masks. I watched the video of the “peaceful” protestors yelling and screaming and spitting on the CHP officers in Sacramento. They had no masks and no social distancing. Most of the videos I saw of protestors … no social distance, no mask, no limit of 12 people … So there is NO WAY you can tell me that they had nothing to do with this.
@cheesrburguesa
Calling attention to ALL factors of the surge is how to get to truth. Important to remind that there is definitely not just ONE cause here.
WC Reaident, do you have stats on the amount of tests done on 5/23 vs 7/4? Is the rate of positivity going up exponentially?
@concord Resident – I have been ignoring the rate of positivity values as they are meaningless, at least for Contra Costa County and likely most regions.
Let’s say that one in a thousand people has COVID-19 at present. If you do a random sample of 3000 tests you would expect to find three people or a 0.1% rate of positivity.
Let’s say that on the same day that 100 people out of your community walk in with symptoms that appear to be COVID-19, that 80% of them are confirmed with COVID-19, and the other 20% have the flu or something else. The rate of positivity for this group is 80%.
The county mashes those two groups together and reports that they did 3100 tests and that 83 of them are positive. It’s a 2.68% rate of positivity.
On the following day we are only able to do 2000 random sample tests and find two people. The rate of positivity is still 0.10%. 100 symptomatic people people walk in with 80% of them testing positive. The county reports 2100 tests and 82 of them positive or a 3.90% rate of positivity.
On the third day the county gets busy with survey testing and does 4000 of them, finding four people. The usual 100 people walk in with the usual 80% positive. 4100 tests, 84 positive, and a 2.05% rate of positivity.
As county won’t tell us how many of those tests were of symptomatic people to confirm COVID-19 vs. survey screening of asymptomatic people the overall rates of positivity are meaningless. In the three example days I just mentioned the rate of infection is exactly the same but we have overall rates of positivity ranging from 2.05% to 3.90%
That’s why the rate of positivity is meaningless without additional information to help us interpret the results.
I have already graphed the number of tests at https://imgur.com/a/RSQK6hP It’s the solid red line. The dotted red line is the 7-day moving average and was at 993 on 5/23 and is at 1,928 tests/day as of 7/4/2020.
While it seems to be a meaningless value I have added a graph of the rate of positivity to https://imgur.com/a/RSQK6hP I started at 4/4/2020. In March testing was so limited that we were hitting rates of positivity as high as 80%. If I include the March data on the graph it squishes the data for the following months into a flat line near the bottom of the graph.