
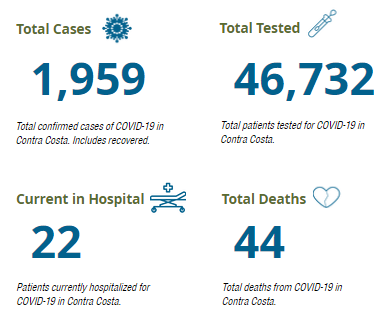
Contra Costa is now reporting 1,959 confirmed cases of coronavirus in the county, which is 38 more than yesterday.
There have been 44 coronavirus-related deaths in Contra Costa.
For more information, please visit the health department’s COVID-19 dashboard.
Do you all know that the test kits are not accurate? They are playing Russian roulette with us.
Be on the alert, because here is what is coming next.
Drawing from old undetected cases (a lot of them are there), and calling them ‘suspected’ or using AB tests to detect them – but reporting them as current Covid cases.
This is a trick called Legacy Data Laundering.
Agree.
I have always suspected from the beginning that the test kits are not accurate. But people follow like sheep and believe anything they are fed.
Because politicians have found that the Cower-in-Place policy is a crisis they don’t want to waste. Who in their wildest dreams would have thought that our elected government could pull this off short of an alien invasion or zombie apocalypse?
We need two more data points:
1) For those who were hospitalized and recovered what long term consequences are they facing from lung damage, heart damage, etc.
2) What are these medical bills look like for even short hospital stays let alone the longer term with more ICU time.
What good would those numbers be? Some kind of twisted fearmongering to make us all feel worse about not wanting to starve or end up homeless?
Hey, Average Citizen, you can either go bankrupt with certainty when eviction protection and federal boosts to unemployment end on 7/31 or you can face far lower odds of far more catastrophic bankruptcy by ending the lockdown.
Pick your poison, citizen, and know that neither the feds nor the state have your back.
At least the second option might prevent our current economic disaster from turning into a full-fledged depression.
You’re absolutely right! As someone who works in rehabilitation, the outcomes of those who have “recovered” are not good. There are a lot of long-term effects, voice difficulty, inability to swallow food, generalized weakness for months.
The same people who whined about the stay at home being very early are now saying, it worked so well why are we being careful now.
It’s as if they have no ability to understand cause and effect and what happens if you screw it up later on.
Can we defund our health department?
Or at least get rid of The people that run the show? They are incompetent as can be.
This pandemic was really too good for it to go to waste. I’m quite sure researchers are harvesting data and making comparisons among counties and the varying approaches to the SIP, and will decide who had the best plan. Contra Costa is one of many petri dishes in determining what the official response will be to the next health emergency. Was it more effective than Alameda County? Santa Clara? Los Angeles?
All the data is being harvested to make a standardized approach that is the most effective based on what the long term results indicate. It may take years, no decades, to collect, analyze, and develop what has otherwise been a considerably spur-of-the-moment, flying-by-the-seat-of-the-pants response to this virus.
From 6/6/2020 to 6/13/2020:
Age 20 or under increased by 52 cases which is 17.9% of the total increase.
Age 21 to 30 increased by 45 cases which is 15.5% of the total increase.
Age 31 to 40 increased by 61 cases which is 21.0% of the total increase.
Age 41 to 50 increased by 47 cases which is 16.2% of the total increase.
Age 51 to 60 increased by 35 cases which is 12.0% of the total increase.
Age 61 to 70 increased by 24 cases which is 8.2% of the total increase. There was 1 death in the past week in this age range.
Age 71 to 80 increased by 11 cases which is 3.8% of the total increase. There was 1 death in the past week in this age range.
Age 81 to 90 increased by 13 cases which is 4.5% of the total increase. There was 1 death in the past week in this age range.
Age Over 90 increased by 3 cases which is 1.0% of the total increase. There were 2 deaths in the past week in this age range.
The total increased by 291 cases. There were 5 deaths in the past week.
I looked into the Long Term Care Facility (LTCF) data to see if there was a way to separate their numbers from the cities. The county only reports on the total number of cases and does not break out the numbers of active cases nor deaths per facility.
An outbreak that started in early April in Pleasant Hill continues. A total of 44 residents and 34 staff (78 total) have been confirmed with COVID-19. The total for Pleasant Hill in the by-city table is 72. We know 44 of those are from the LTCF meaning Pleasant Hill’s community total is 28.
There is also an outbreak at a facility in Concord that started in mid-May affecting 42 residents and 13 staff (53 total). The total for Concord in the by-city table is 237. We know 42 of those are from the LTCF meaning Concord’s community total is 195.
While the LTCF outbreak in Orinda has been contained they had 39 resident and 33 staff cases. The total for Orinda in the by-city table is 57. We know 39 of those are from the LTCF meaning Orinda’s community total is 18.
There’s a new outbreak at an LTCF in El Sobrante but the county is not reporting any numbers to protect privacy as less than 11 people have been confirmed with COVID-19.
This was interesting. Started in June 2019. Don’t know if it’s COVID-19 or not.
https://abcnews.go.com/US/respiratory-outbreak-investigated-retirement-community-54-residents-fall/story?id=64275865
@ZZ – The June 2019 outbreak in Virginia does not seem like it was caused by a coronavirus as the physical structure of a coronavirus is very easy to spot. One report said they found a rhinovirus in the samples but they were not sure if that was the virus responsible for the outbreak. It also does not seem to have been as contagious nor deadly as the SARS-CoV-2 virus that causes COVID-19. The June 2019 outbreak was contained and suppressed using standard cleaning and hygiene protocols. That’s something that does not work as well for SARS-CoV-2.
Thanks @WC Resident
I forgot to note that I also updated the active cases chart at https://imgur.com/a/RSQK6hP The most recent chart is at the top.
So how many deaths have there been for the age group of 18 and under and 31-40 years of age? You state the deaths only for 61 years and above. Has no one that age died in CCC and only 60 and above have?
@Raiderette – My numbers were for the past week. Here are the numbers for all cases and deaths we have had so far.
Age 20 or under has 226 cases which is 11.6% of the total cases. There have been no deaths in this age range.
Age 21 to 30 has 313 cases which is 16.0% of the total cases. There have been no deaths in this age range.
Age 31 to 40 has 337 cases which is 17.2% of the total cases. There was 1 death in this age range resulting in a 0.30% death rate.
Age 41 to 50 has 344 cases which is 17.6% of the total cases. There have been no deaths in this age range.
Age 51 to 60 has 304 cases which is 15.5% of the total cases. There have been 4 deaths in this age range resulting in a 1.32% death rate.
Age 61 to 70 has 205 cases which is 10.5% of the total cases. There have been 7 deaths in this age range resulting in a 3.41% death rate.
Age 71 to 80 has 114 cases which is 5.8% of the total cases. There have been 7 deaths in this age range resulting in a 6.14% death rate.
Age 81 to 90 has 78 cases which is 4.0% of the total cases. There have been 12 deaths in this age range resulting in a 15.38% death rate.
Age Over 90 has 34 cases which is 1.7% of the total cases. There have been 13 deaths in this age range resulting in a 38.24% death rate.
There are a total of 1955 confirmed cases resulting in 44 deaths resulting in a 2.25% death rate.
However, it’s estimated that heath authorities know of about 40% of the cases. The other 60% either have no symptoms or the symptoms were so mild the person never felt the need to contact a doctor. With that in mind, here’s restated table
Age 20 or under has had an estimated 565 cases. There have been no deaths in this age range.
Age 21 to 30 has had an estimated 783 cases. There have been no deaths in this age range.
Age 31 to 40 has had an estimated 843 cases. The 1 death means the death rate is 0.1% of the cases for this age range.
Age 41 to 50 has had an estimated 860 cases. There have been no deaths in this age range.
Age 51 to 60 has had an estimated 760 cases. The 4 deaths means the death rate is 0.5% of the cases for this age range.
Age 61 to 70 has had an estimated 513 cases. The 7 deaths means the death rate is 1.4% of the cases for this age range.
Age 71 to 80 has had an estimated 285 cases. The 7 deaths means the death rate is 2.5% of the cases for this age range.
Age 81 to 90 has had an estimated 195 cases. The 12 deaths means the death rate is 6.2% of the cases for this age range.
Age Over 90 has had an estimated 85 cases. The 13 deaths means the death rate is 15.3% of the cases for this age range.
There are a total of 4889 estimated cases resulting in 44 deaths resulting in an overall 0.9% death rate.
The 40% / 60% rule does not apply to deaths as it’s very unlikely there have been any deaths caused by COVID-19 that are not known to the county.
However, that 40% / 60% rule applies to the entire population. I suspect as you get into the older age groups that more cases have symptoms meaning the numbers are more likely to be closer to what’s in the first table than the second and that for the younger ages the odds are better than even the 0.1% death rate for the age 31 to 40 group.
There’s more to this than CCC.
Red states are playing with their numbers to fit the trump agenda. But facts are facts. Use NYC as a guide for preparedness. Follow GovCuomo. It’s not perfect there either, there are lots of deniers. But he got the numbers down . He just warned NY to keep wearing masks or he’ll close the state again.
Cuomo also ordered deaths to be reported as COVID deaths if they were suspected or if someone tested positive, even if the death was not actually caused by COVID (e.g. heart attack, cancer, accident, etc). Many doctors complained about the liberal approach to the death count, but I read that hospitals got paid extra by Medicare for COVID cases, so there is a perverse incentive to include it as a cause of death. In WA, officials admitted counting gunshot victims as COVID deaths, after the governor angrily (and falsely) dismissed claims of this as “disgusting” and “malarkey”.
Cuomo has made big mistakes, such as waiting too long to take the virus seriously and ordering all nursing homes and senior facilities to accept any COVID patient, whether they were ready for it or not. History will tell if his actions were a net positive or not.
Crazy fun with statistics. I prefer to stay safe.
I’m still searching for tracing reports from those who have been diagnosed with Covid-19. I would like to track the statistical comparison between those who stated (and proved) that they caught it from a family member….. or from a co-worker (cross-checked)…. or “unknown”.
Also, WHICH longterm care facility in Concord has had an outbreak, please?
Here is what the state reports on Skilled Nursing Facilities….https://www.cdph.ca.gov/Programs/CID/DCDC/Pages/COVID-19/SNFsCOVID_19.aspx
@Antler – I have not seen anything that looks remotely usable in the data published by CC county that could help answer your question.
I’m not sure the county has that data. For the most part, it seems the county reports are summaries of reports from medical facilities. It’s possible the county does not know the names of the patients much less details about where they may have become infected.
For a while the county has been asking for contact tracing volunteers. That implied they would know some details but the county has since then remained silent on if the contact tracing program was ever staffed and is operating. In early April they said “The county’s public health system no longer has the capacity to individually notify and track everyone with COVID-19 and their close contacts who may have been exposed to the virus.” Having that capacity was one of the state imposed goalposts to reopening but perhaps those have changed too…
as of 06/14:
1,959 confirmed cases in CCC with 44 deaths = 2.25% death rate.
FEAR
FEAR
FEAR!!!
Doesn’t mean they died or that they are even sick.
Extremely high % chance that you will live if you do contract it.
COVID didn’t work. Riots didn’t work. 2nd “wave” of either won’t work.
I wonder what is next?
Reverting to form. Thanks, Ozzie.
I think you have it backwards. We delayed reopening and perhaps BECAUSE of that we are seeing the lower hospitalization rate. Are you complaining that we are better off than the state as a whole?