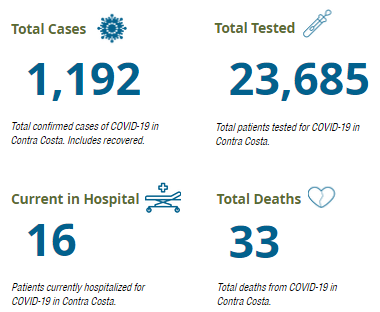
Contra Costa is now reporting 1,192 confirmed cases of coronavirus in the county, which is 37 more than yesterday.
1,002 people in Contra Costa County with COVID-19 have fully recovered.
There have been 33 coronavirus-related deaths in Contra Costa.
Currently, the county has 157 active cases of COVID-19.
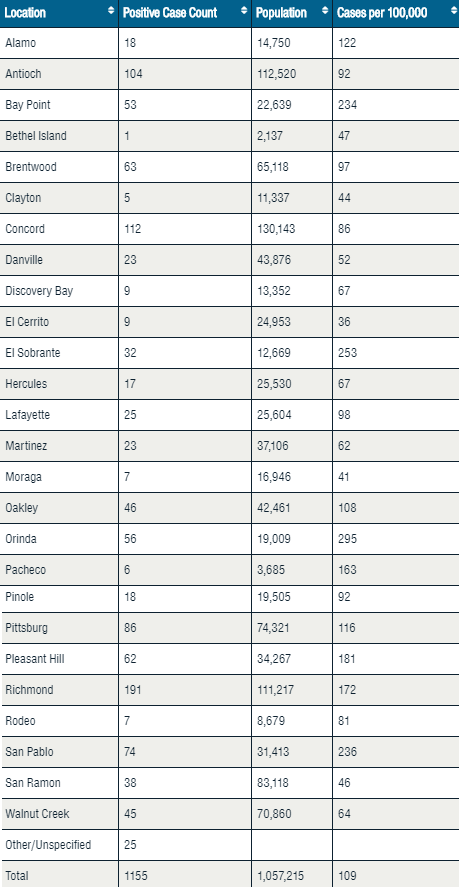
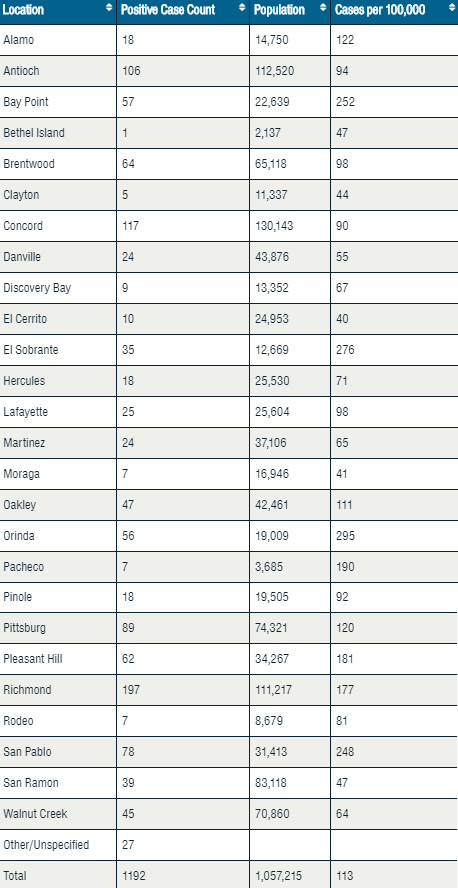
Below is a city-by-city breakdown of coronavirus cases for Contra Costa County:
RELATED STORY FROM MONDAY: 1,155 Confirmed Cases Of Coronavirus (134 Active Cases) In Contra Costa County – 9 More Than Yesterday (988 Recovered)
RELATED INFO FROM MONDAY (cases by city):


Ode to Contra Costa:
Keep sanitizing your hands but never clean the iphone you use on the toilet, and never look up from said phone to keep a social distance;
Keep bringing your fake service dogs into restaurants when they have been deemed carriers; Keep aceepting people’s recyclable beverage containers (really!?!?) and when you wise up, stop taking them but keep on charging the CRV; Keep letting outhouses and trash from “essential” construction workers line our streets, along with their wipes; Keep telling your neighbors to MOVE “somewhere there are no people” as you make inconsiderate noise and love on the noise-making undocment-eds you hired to start at 6am with all of your biiiiig heart (try telling a veteran with PTSD your noise is entitled); Keep allowing healthcare workers to stand in line at the grocery store in unsterilized scrubs, fresh from caring for corona patients while Italy puts clothing on 24-hour quarantine after it’s been tried on in retail stores.
DID I MISS ANYTHING?
At the risk of losing all the friendships I’ve made with people who make no sense, allow me to say that California should break off into the Pacific Ocean immediately after all the smart people get out.
The number of active cases is creeping up. I posted a graph to https://imgur.com/a/RSQK6hP that shows the numbers from March 8 to May 18.
Makes sense. With increased testing, there will be an increased number of active cases. The thing to look at is the percentage of total cases based on total tests. That percentage has been lower every day. One thing I would like to know is how many of these tests are retests and how many are false positives or negatives.
Do you have a graph that correlates these to the number of tests? More tests = more active cases. Luckily the number hospitalized has been on a downward trend.
@concord Lifer
The number of tests doesn’t necessarily correspond to the number of active cases. A confirmed case may be give multiple tests after confirmation of the case to determine if the case is still active.
I updated https://imgur.com/a/RSQK6hP to add a second graph that shows the number active cases and the number of tests on the same graph. I divided the number of tests by five to get the numbers to fit on the same scale as the number of active cases. Keep that in mind as the number tested is rising 5x more steeply than the graph shows.
The active cases graph shows four phases. 1) A slow climb until 3/19/2020, 2) a steep climb to a peak of 230 active cases on 4/13/2020, 3) a steep descent to 130 active cases on 4/24/2020, and 4) a slow climb since 4/24/2020.
Starting on 4/24/2020 It appears there is a correlation between the number of tests and number of new COVID-19 cases. I decided to not smoothen the data using 7-day rolling averages.
However, that correlation is not proven as there is a lot we don’t know about the testing. One of the things that has never been reported is why tests were conducted. From media reports it seems that early on they would only test people that showed many symptoms of COVID-19 and were medically at risk. As testing became more available they added survey screens of some essential workers at high-risk of exposure but never reported these separately from the tests of likely COVID-19 candidates.
I too have wondered if and how re-testing was included in the county numbers.
I suspect if a false positive or negative is found that they go back and adjust the data reported for previous days. The county has constantly been making small adjustments which they have explained as “data quality assurance efforts” at times. Even with today’s report they adjusted 5/16/2020 from the previously reported 23 new COVID-19 cases to 24 new cases and 5/17/2020 was adjusted downwards by one from 11 to 10. That one looks like the date for one person was changed from 5/17 to 5/16.
Sweet! I do like line graphs.
People in hospital and deaths remaining steady
Here is a Link to Cease and Desist Letter.
https://ssbamerica.com/cease-desist-letter/