
This is the COVID-19 daily update on Claycord.com:
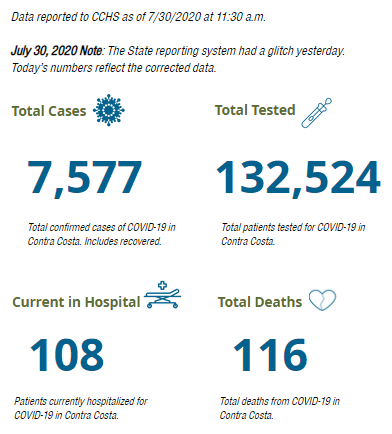
July 30, 2020 Note: The State reporting system had a glitch yesterday. Today’s numbers reflect the corrected data, according to Contra Costa County.
-
-
-
- 881 active cases of COVID-19 in Contra Costa County.
- 86 new cases of COVID-19 in Contra Costa County since yesterday.
- 6,580 people have fully recovered from COVID-19 in Contra Costa.
- 77 of the 116 deaths were in long-term care facilities.
- There are currently 23 active outbreaks of COVID-19 at Contra Costa County long-term care facilities (eight more since Monday)
- 69 of the 116 deaths have been people over the age of 81.
- Only 1 person under the age of 50 (they were in the 31-40 age group) has died from COVID-19 in Contra Costa County.
- Nobody under the age of 17 has died from COVID-19 in the State of California.
- 973 tests were conducted yesterday in Contra Costa County. The seven day positive average is 8.8%.
- 564 homeless people are currently placed in motel/hotel rooms in Contra Costa County. Placements are approved for homeless people who are awaiting COVID-19 test results or those who are considered at high risk.
-
-
PRIOR DAY TOTALS:
The population of Contra Costa County is about 1.1-million.
18 comments
Today, Dr. Farnitano reported that the occupied ICU beds in CCC was at 152. It would be super helpful if they reported the number of ICU beds related only to Covid patients because there are 36 Covid patients in the ICU. So, roughly 24% of patients in the ICU is due to Covid. This is kind of important considering that many are fearful to leave their house at this time. Another way to quell the fear for some right now is to report the deaths WITH Covid v. FROM Covid. By doing this, one doesn’t have a cloaked view of the data and then could surmise that Covid’s potency is affecting mostly the patients with compromised immune systems, comorbidities or the elderly. By the way, this is not to diminish any of the lives lost, but to help assuage the anxiety of our residents. I think it also would be helpful to breakdown the positive numbers of asymptomatic v. symptomatic. With a survival rate of 99.8%, we actually shouldn’t be shuttered like this. #opencalifornia #openccc #openschools
I second that. Thank you. Finally someone with some real knowledge and questions and demand for answers
@ truth please…! If these great questions you asked were answered honestly then maybe just maybe we wouldn’t be living in fear.
You’re making too much sense. You need to talk to the dumb, dumb teachers..
@truth please,
You brought up concerns that we all have…data is not transparent. I watched the 7/28 Board of Directors Meeting and according to Anna Roth–74% of ICU beds occupied, 40 were for Covid-19 patients. She did say that the numbers for ICU beds are being adjusted(272 total) by not counting the neonatal units (73) to reflect now 199 beds total and that would cause some confusion. Another interesting note is that she said as of 7/15 the Federal Government has mandated state covid-19 reporting be sent to Department of Health and Human Services, not CDC…so it’s my assumption that therein lies the problem with the recent data miscalculations. Take a look at the video:
http://contra-costa.granicus.com/MediaPlayer.php?publish_id=75350be7-d1f2-11ea-b5c3-0050569183fa
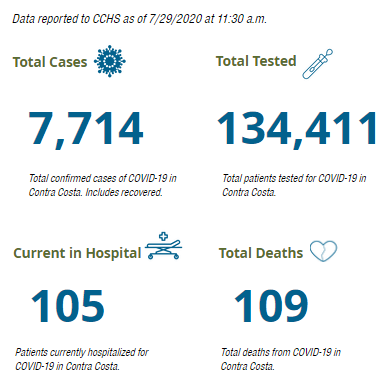
Something looks really wrong with the numbers here. If total cases yesterday were 7714 and total cases today are 7577, we’d have 137 cases less. Also, yesterday there were over 1000 active cases and today there are 800 and change, again, fewer active cases, not more. Additionally, the total tested number is lower by roughly 2000 as compared to yesterday. What gives?
The numbers reported for 07/28/2020 included the data for something else that should not have been reported. It’s possible they included the suspected cases rather than the confirmed cases. They went back to the normal numbers for 07/29/2020.
Excluding that glitch, I believe something is wrong though am not sure it’s the numbers that are wrong. The numbers should not swerve around the way they have been. See https://imgur.com/a/U0N9iTt which is a graph of the number of active cases plus the number of new cases per day.
The number of active cases behaved normally until July 6th when it was starting to transition to exponential growth. Instead, the graph takes a near right angle turn and goes flat at about 1300 to 1200 active cases. On July 28th it took another right angle turn down to 900 cases.
Active cases is a 14-day rolling sum. Rolling sums are used to smoothen out data, much like rolling averages. Thus, when active cases jumps like a staircase it tells me we are hitting artificial limits and not measuring what should be a smooth growth or decline in the number of active cases in the community. My first thought was we hit a limit on the number of new cases per day that could be added to the system.
It’s possible the strange behavior is caused by the testing backlog. I believe the county reports all tests administered in a day but if it takes several days for the tests to be processed then we initially show an artificially low positivity rate. For example, let’s say we run 2000 tests in a day but can only process 500 of them that day. If 5% of those are positive that’s 25 new cases. The county says 2000 tests, 25 new cases, and a 1.25% positivity rate. Over the following days more of that batch of 2000 tests is processed. Eventually we’ll see 100 new cases for that day which is a 5% positivity rate.
The “glitch” is actually the false numbers and the incompetent governor. Where’s “The Govenator” when you need him?!
@,Andrew – It’s so much more complex than your false numbers/political explanation. The Governator has in reality been in accord with the current state government and health department plans and directives. Does that help make things clearer?
Oh it’s so much more complex..it’s very complicated complex calculations. You just aren’t smart enough to understand. Only educated people with double plus plus degrees have the intelligence to comprehend.
Arnold Schwarzenegger siding with the state government makes it clear that he is an idiot as well. As if we didn’t know already.
“Accord” is probably not the best description of those relationships. Visit Assemblyman Kevin Kiley’s website for a more complete description.
New cases look better today
Does anyone know how to obtain numbers on how many of the deaths are medical professionals who contracted COVID due to their work??
These numbers seem to be BS… I believe it is a lot higher and things are getting worse. With so many outside dining options now and people packing them and not wearing masks.. it’s only going to get worse. This is a highly contagious disease not just an illness. Sadly I wish these numbers were more accurate but so many things in play to mess with them. All you can do is protect yourself and loved ones and be safe and thoughtful of others and wear a damn mask!!!!! It’s not complicated and it’s easy and will save lives… maybe not yours.. BUT it will stop the spread. It’s that simple.
I was reading elsewhere that the day new infections are reported tend to lag the actual test day by up to two weeks. So we may very well be seeing two week old infection numbers. July 21st was the peak for reported cases in California so far, according to Google. We could very well be three weeks past the top of the spike.
Here’s hoping.
Something is very different about the deaths as well.
First I dont see them posted in list as usual.
Second, normally daily reports are 0,1, and sometimes 2. But doing the math its 7.
That’s correct. There were seven deaths in a day which is the most in a day for CC county. The previous record, if you want to call it that, was six deaths on 6/20/2020. We also saw five deaths in a day on 6/15/2020, 6/17/2020, 6/23/2020, and 6/24/2020.
Clusters of deaths is not unexpected as COVID-19 will be detected at a LTCF once a resident becomes ill. They then test everyone ASAP and discover many cases. As the residents are catching COVID-19 within a day or two of each other their deaths tend to within a few days of each other.
Of the 78 LTCF residents or staff that were hospitalized, 77 of them died.
Hmmmmm…. On Wed there were 81 deaths attributed to Nursing homes… Today there are only 77. Did some rise up? Is it a miracle? OMG and LOL.
Comments are closed.